TL;DR (QUICK ANSWER)
New Relic is powerful, but many teams eventually realize they are paying enterprise observability costs for workflows they only use during incidents. Lightweight monitoring tools like UptimeRobot and Hyperping work well for uptime visibility and alerting, while platforms like SigNoz, HyperDX, and Grafana target teams that still need tracing, telemetry, and OpenTelemetry-based observability without deeper vendor lock-in. Larger organizations operating complex cloud infrastructure usually compare Datadog and Dynatrace instead.
New Relic is one of the biggest names in observability. The platform covers application performance monitoring (APM), infrastructure monitoring, logs, tracing, telemetry, and cloud visibility across large environments.
But many teams searching for a New Relic alternative are usually trying to simplify operational complexity, control observability costs, or stop paying enterprise-level pricing for tooling they barely use.
The alternatives in this list reflect those very different realities. You’ll find lightweight monitoring tools, OpenTelemetry-focused platforms, enterprise observability suites, and cloud-native options built directly into AWS or Azure.
| Alternative | Best used for | Deployment style | Starting pricing | Biggest advantage over New Relic |
| UptimeRobot | External uptime monitoring | SaaS | Free plan available; paid from $9/mo | Simpler and dramatically cheaper for uptime-focused teams |
| Hyperping | Modern uptime monitoring and status pages | SaaS | Free plan available; paid from ~$24/mo | Faster setup and cleaner workflows |
| SigNoz | OpenTelemetry observability | Self-hosted / cloud | Open-source self-hosted option; paid from ~$49/mo | Avoids vendor lock-in and reduces telemetry costs |
| ClickStack ( formerly HyperDX) | ClickHouse-based observability | Cloud / self-hosted | Open-source stack; cloud/infrastructure costs vary | Fast, SQL-friendly observability with lower user-access friction |
| Grafana OSS Stack | DIY observability stacks | Self-hosted | Free OSS; infrastructure costs vary | Full infrastructure control and modular observability |
| Datadog | Enterprise cloud observability | SaaS | Usage-based pricing | Deep cross-system infrastructure visibility |
| Dynatrace | Enterprise root-cause analysis | SaaS | Enterprise/custom pricing | Strong automation and AI-assisted troubleshooting |
| AWS CloudWatch | AWS-native monitoring | AWS-native | Pay-as-you-go AWS pricing | Built directly into AWS infrastructure |
| Azure Monitor | Azure-native monitoring | Azure-native | Consumption-based Azure pricing | Tight integration with Microsoft ecosystems |

Key takeaways
- New Relic pricing often becomes difficult to control as telemetry, logs, traces, and team access expand.
- Many smaller teams eventually realize they mainly need uptime monitoring and incident awareness rather than full observability tooling.
- UptimeRobot and Hyperping are better fits for lightweight monitoring and fast setup.
- SigNoz, HyperDX, and Grafana appeal to teams prioritizing OpenTelemetry compatibility and lower vendor lock-in.
- Datadog and Dynatrace target organizations operating large-scale cloud-native infrastructure and distributed systems.
- AWS CloudWatch and Azure Monitor may already cover the needs of teams heavily invested in AWS or Azure ecosystems.
Why teams look for New Relic alternatives
For many teams, the issue is not whether New Relic is powerful. It absolutely is.
The problem is that a lot of companies only rely heavily on a relatively small portion of the platform day to day. During outages or production incidents, engineers may jump into traces, inspect SQL queries, or investigate application slowdowns. Outside those moments, large parts of the observability stack often sit relatively untouched while costs continue growing in the background.
That disconnect is a major reason more teams are reevaluating whether a full enterprise observability platform still makes sense for their actual operational needs.
Sticker shock and price scaling problems
First and foremost, pricing complaints dominate discussions around New Relic.
Across G2, TrustRadius, and PeerSpot, users repeatedly describe observability costs becoming harder to control as telemetry volumes grow.
Log ingestion, trace retention, custom metrics, and seat-based pricing can all scale aggressively in larger environments. Several reviewers also describe frustration around broader team access during incidents. Once support teams, operations staff, or additional engineers need visibility, costs can rise quickly.
A particularly sore point has been migration away from legacy pricing plans. On CostBench, users reported annual costs increasing drastically after being pushed onto newer pricing structures.
The platform has a steep learning curve
New Relic’s depth is one of its biggest strengths, but it is also one of the platform’s biggest reasons users look for alternatives.
Reviews across TrustRadius and Info-Tech Research Group regularly mention a dense interface, confusing navigation, and configuration workflows that can take a lot of time to learn properly.
The complexity can be worthwhile for organizations treating observability as a core engineering discipline. Smaller teams often reach a different conclusion. Instead of simplifying operations, the platform itself becomes another system requiring constant attention and maintenance.
Retention limits and support frustrations
Data retention catches a lot of teams off guard.
New Relic’s free tier includes only 8 days of retention, with longer historical storage requiring additional spend. Reviews on G2 describe retention limits becoming frustrating when teams need to revisit older incidents or analyze long-term performance trends.
Customer support adds to the frustration for some users. Reviewers on PeerSpot describe slow response times, templated replies, and difficulty getting personalized troubleshooting help despite enterprise-level pricing.
Many teams simply don’t need this much observability
For companies running large distributed systems, New Relic’s breadth can absolutely be justified. Teams heavily dependent on tracing, infrastructure analytics, telemetry correlation, and deep application visibility often get real value from the platform.
But many smaller SaaS companies and lean engineering teams eventually realize they’re mostly opening New Relic during outages, performance investigations, or production incidents.
Meanwhile, costs keep growing in the background.
That shift in thinking has helped drive interest toward OpenTelemetry-focused platforms like SigNoz and ClickStack, along with self-hosted Grafana stacks and lighter tools like UptimeRobot and Better Stack.
NRQL lock-in
Some engineering teams also cite concerns around vendor lock-in. New Relic’s proprietary NRQL query language can make migrations more difficult, particularly for organizations that have built dashboards, alerts, and workflows around the platform.
This is one reason OpenTelemetry-based alternatives have gained traction.
What are you actually using New Relic for?
A lot of companies adopt New Relic expecting it to become the center of their observability stack, then reality settles in.
Some teams find the platform becomes a very expensive way to answer a handful of recurring questions:
- Is the API down?
- Why did response times spike?
- Which deployment broke production?
- Why is this query suddenly slow?
- Which service is throwing errors?
Those are important problems, but they don’t always require a massive observability platform with enterprise-level telemetry costs attached.
As such, companies move toward very different types of alternatives.
Teams mainly focused on uptime visibility, alerting, and incident awareness often end up happier with tools like UptimeRobot or Hyperping.
Engineering organizations working heavily with tracing, logs, telemetry, and OpenTelemetry pipelines usually need a deeper observability layer. That is the space tools like SigNoz, ClickStack, and the Grafana OSS stack are targeting.
At the enterprise level, the conversation shifts again. Platforms like Datadog and Dynatrace compete less on simplicity and more on infrastructure correlation, automation, and large-scale visibility.
And for plenty of AWS- and Azure-centric teams, the answer may simply be to use more of the tooling already included in your cloud stack.
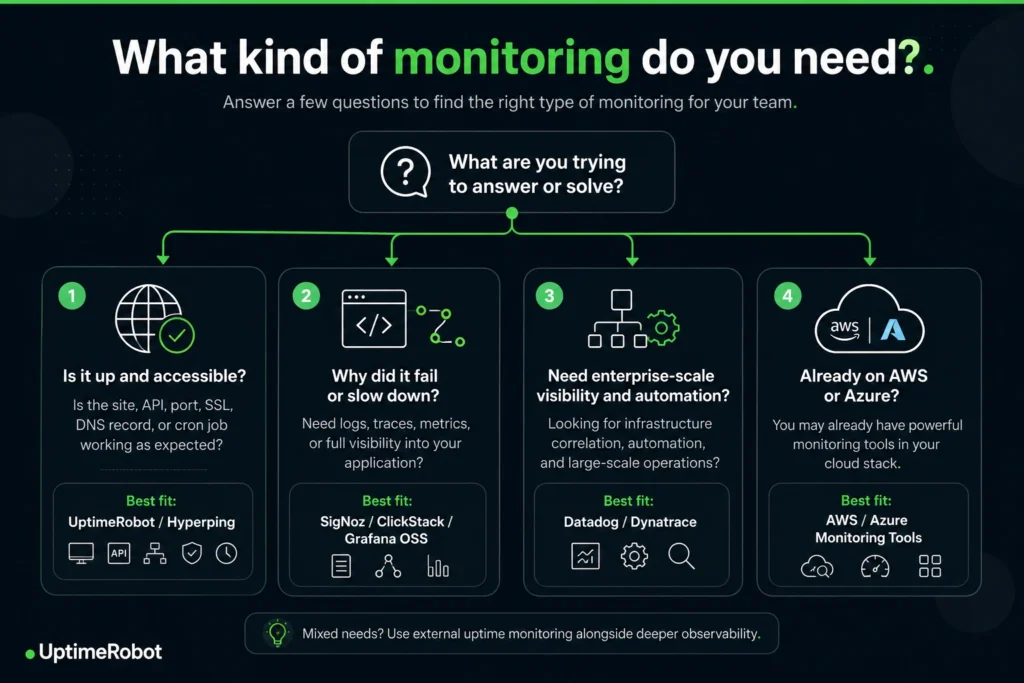
What kind of monitoring do you need chart
Lightweight monitoring and operational alternatives
If you’ve found that you don’t need all the bells and whistles that come with New Relic and simple monitoring is more suited to your needs, UptimeRobot and Hyperping offer just that.
1. UptimeRobot
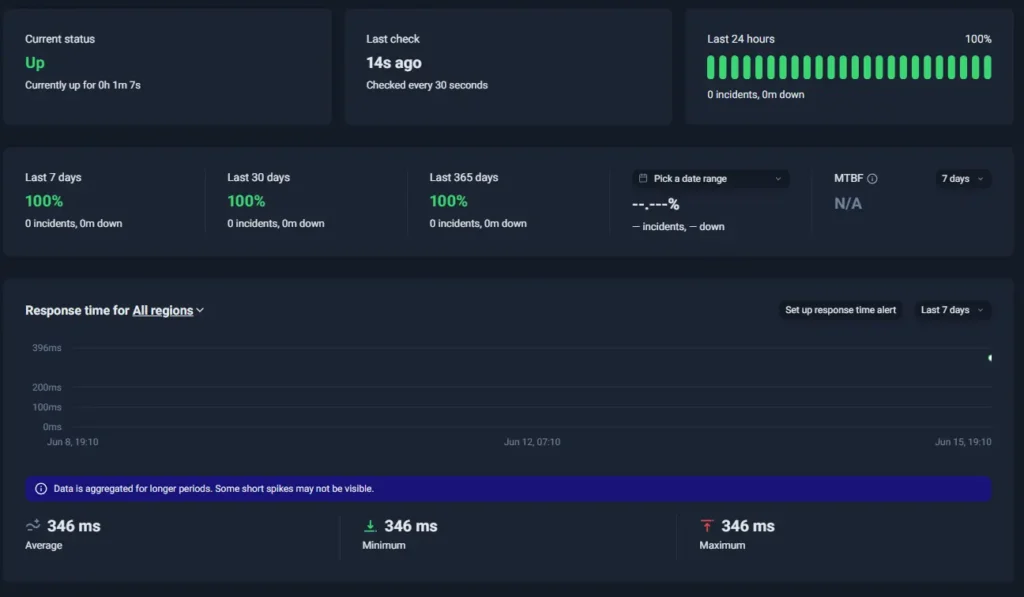
UptimeRobot dashboard
Best for: Teams that want reliable external monitoring without the cost and overhead of a full observability platform
UptimeRobot remains one of the most widely used uptime monitoring platforms, with more than 3.2 million users globally. A large part of that appeal comes from focus.
While New Relic expands deeper, UptimeRobot stays tightly centered on external monitoring and incident awareness. Setup is fast, the interface is easy to navigate, and teams can start monitoring production services without spending weeks configuring observability pipelines or learning a dense platform.
The platform supports:
- Website and endpoint monitoring
- API monitoring
- SSL certificate monitoring
- DNS, ping, and port monitoring
- Cron job monitoring
- UDP monitoring
- Customizable status pages
Beyond monitoring, UptimeRobot also provides several free utilities and learning resources for developers and operations teams.
Free tools, no account required:
- Subnet calculator for network planning
- Website change detection to track page updates
- MX lookup for verifying email server configuration
- Crontab generator for creating cron expressions
- Uptime calculator to estimate service availability
UptimeRobot also supports a broad range of integrations and alerting channels, including Slack, Microsoft Teams, Discord, Telegram, PagerDuty, webhooks, SMS, and voice calls.
That simplicity is exactly why the platform is widely used by:
- Developers
- DevOps teams
- Agencies
- Support teams
- Smaller SaaS companies
- Internal operations teams
The Free plan includes up to 50 monitors with 5-minute intervals and no per-seat pricing, making it one of the more accessible monitoring platforms for smaller teams that want external visibility without enterprise pricing or complicated onboarding. Paid plans start at $9/month and monitoring intervals scale down to every 30 seconds.
UptimeRobot feels dramatically lighter when stacked against New Relic. Teams mainly concerned with uptime visibility, alerting, SSL expiration, cron job failures, and incident awareness often find they can cover most of their real operational needs without maintaining a much larger observability stack behind the scenes.
That narrower scope does create tradeoffs. UptimeRobot isn’t trying to compete directly with platforms built around distributed tracing, deep infrastructure analytics, or advanced APM workflows. Organizations operating highly complex cloud-native systems will still need a different category of observability tooling.
But, for many engineering teams, that focused approach ends up being a major advantage rather than a limitation.
| Pros | Cons |
| Free plan includes 50 monitors with 5-minute checks | Not designed for deep observability or APM |
| Fast setup with no credit card required | Less infrastructure visibility than enterprise platforms |
| Supports website, API, SSL, DNS, ping, port, cron, TCP, and UDP monitoring | Advanced analytics and tracing are limited |
| Bulk monitor imports simplify large uptime deployments | May feel too lightweight for large enterprise environments |
| Large integration ecosystem with Slack, Teams, Discord, PagerDuty, Telegram, webhooks, SMS, and voice alerts | Fewer cloud-native observability features than Datadog or Dynatrace |
2. Hyperping
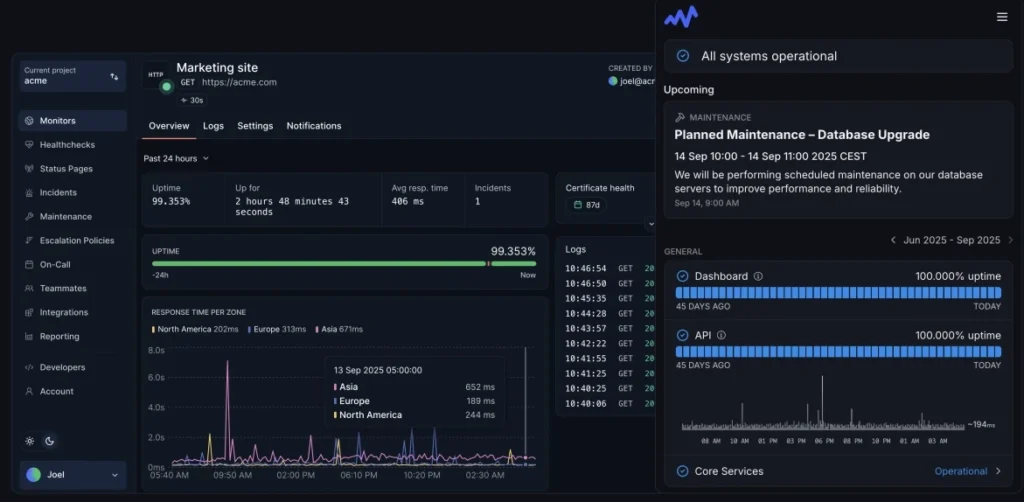
Source: Hyperping dashboard example
Best for: Teams that want a cleaner, more modern monitoring experience with built-in status pages and developer-focused workflows
Hyperping, like UptimeRobot, focuses on a much narrower problem set than New Relic.
The platform combines uptime monitoring, alerting, and status pages without pulling teams into larger observability workflows around tracing, telemetry pipelines, or infrastructure analytics.
Setup is fast, the interface is clean, and overhead stays relatively low even as monitoring expands.
Monitoring capabilities include:
- HTTP(s) monitoring
- Ping monitoring
- Keyword monitoring
- Public and private status pages
- Global monitoring locations
- Alerts through Slack, PagerDuty, email, and webhooks
- Integrations with common developer tools
Compared to New Relic, Hyperping feels much more lean. Teams can monitor production services, configure alerts, and launch status pages quickly without spending significant engineering time managing observability infrastructure behind the scenes.
Hyperping is not designed for deeper observability. Teams operating large cloud-native environments will still need a more sophisticated observability layer.
| Pros | Cons |
| Clean interface and fast setup | Smaller feature set than full observability platforms |
| Built-in status pages and alerting | Free plan has limited monitors |
| Good developer-focused integrations | Pricing increases as monitor counts grow |
| Lightweight operational workflows | No deep tracing or infrastructure analytics |
Open-source and flexible observability platforms
For teams that still want tracing, telemetry, and application visibility without committing to New Relic’s pricing model, the strongest alternatives tend to be open-source or OpenTelemetry-first platforms.
These tools usually appeal to engineering-heavy teams comfortable managing infrastructure and observability pipelines themselves.
3. SigNoz
Source: SigNoz dashboard example
Best for: Engineering teams that want New Relic-style observability without deeper vendor lock-in
SigNoz has become one of the most common recommendations for teams trying to move away from expensive proprietary observability platforms while still keeping modern APM and tracing workflows.
Unlike New Relic, SigNoz is built around OpenTelemetry from the start. Many engineering teams no longer want their instrumentation tightly tied to a single vendor ecosystem. They want the flexibility to route telemetry wherever they choose without rebuilding their entire observability stack later.
For teams frustrated with rising telemetry costs, SigNoz also feels much more transparent. Teams can self-host SigNoz or use the hosted cloud version depending on how much infrastructure ownership they want.
The experience is closest to New Relic in the areas many engineers actually care about day to day:
- Distributed tracing
- Application monitoring
- Service dependency visibility
- Logs and metrics correlation
- SQL query analysis
- Performance debugging
That makes SigNoz attractive for teams that still actively rely on observability workflows, but don’t want enterprise pricing attached to every trace, user seat, or telemetry spike.
The tradeoff is user responsibility.
SigNoz requires more infrastructure involvement, more internal ownership, and a higher tolerance for occasional rough edges. Teams used to highly polished enterprise SaaS tooling may find the experience less mature in some areas.
In engineering organizations prioritizing flexibility, OpenTelemetry adoption, and long-term cost control, those tradeoffs are often worth it.
| Pros | Cons |
| OpenTelemetry-native architecture | Requires more infrastructure involvement |
| Self-hosting available | Less polished than enterprise observability suites |
| Strong tracing and APM workflows | Smaller ecosystem and integration footprint |
| More transparent costs | Requires more engineering ownership |
4. ClickStack from ClickHouse
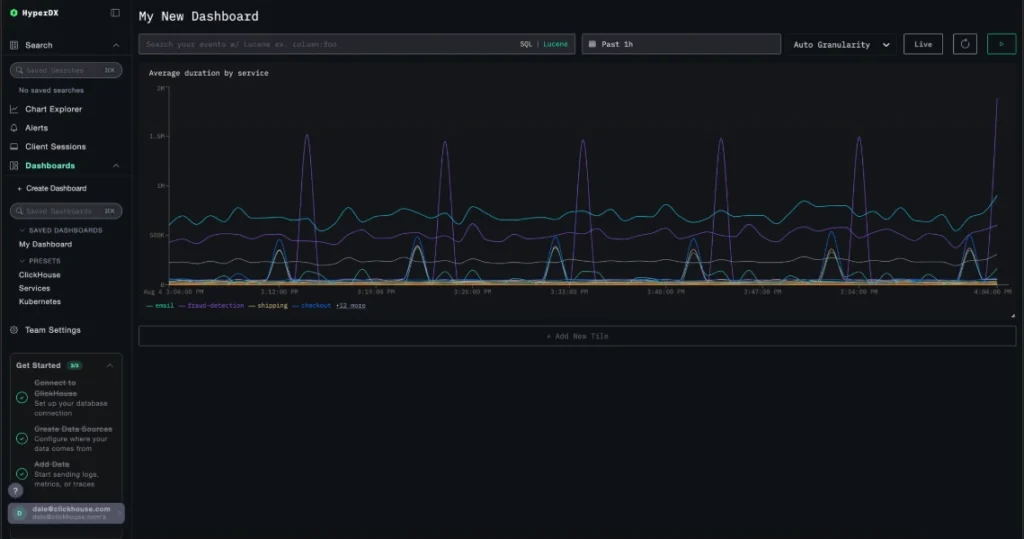
Source: ClickStack dashboard example
Best for: Engineering teams that want OpenTelemetry-based observability without enterprise-style pricing models
ClickStack (formerly HyperDX) changed significantly after being acquired by ClickHouse in March 2025 and evolving into ClickStack, an open-source observability stack combining ClickHouse infrastructure with the original HyperDX UI and debugging workflows.
The platform focuses heavily on fast querying, OpenTelemetry support, collaborative debugging, and lower-cost telemetry storage without the weight of a large enterprise observability suite.
Core capabilities include:
- Distributed tracing
- Logs and metrics
- Session replay
- OpenTelemetry support
- SQL-style querying
- Incident debugging workflows
One of ClickStack’s biggest differentiators is pricing structure. Instead of aggressively monetizing user seats, hosts, or event volumes, the platform focuses more heavily on infrastructure usage.
Managed ClickStack pricing is built around ClickHouse Cloud infrastructure, with storage costs under $0.03 per gigabyte per month and no per-user pricing model layered on top.
That model is most appealing for teams that want broader observability access across engineering, support, and operations without constantly expanding seat costs during incidents.
Teams can either self-host the open-source stack or use ClickHouse Cloud for a more managed deployment experience.
ClickStack works well for engineering organizations already interested in OpenTelemetry workflows or ClickHouse-based infrastructure. The ecosystem is still younger than New Relic, Datadog, or Dynatrace, but the ClickHouse acquisition gives the platform a much stronger long-term foundation than most smaller observability startups typically have.
| Pros | Cons |
| OpenTelemetry-native workflows | Smaller ecosystem than larger observability vendors |
| More collaborative pricing structure | Less mature than New Relic or Datadog |
| Self-hosted and managed deployment options | Fewer enterprise-focused workflows |
| Fast querying and lightweight workflows | Smaller adoption footprint than larger observability platforms |
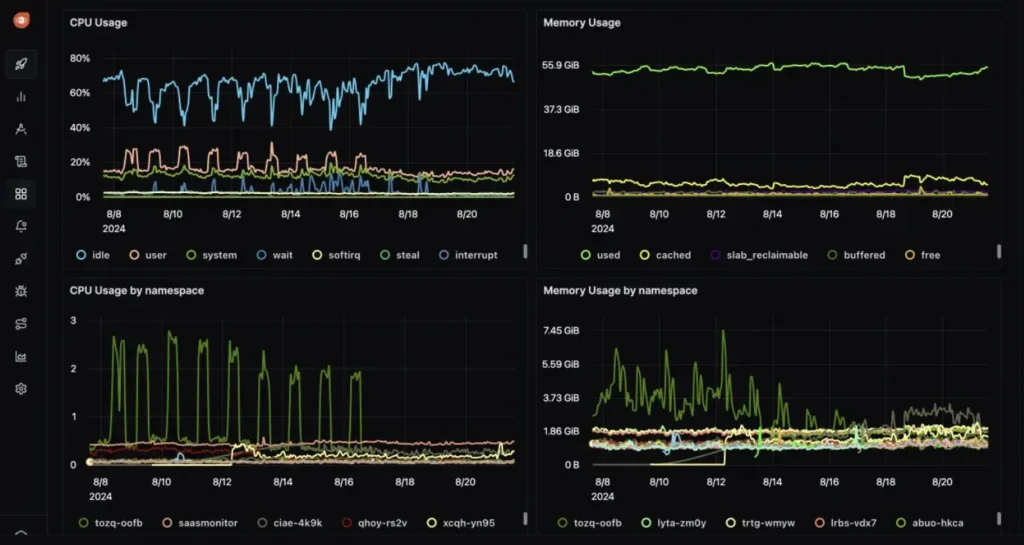
5. Grafana OSS Stack
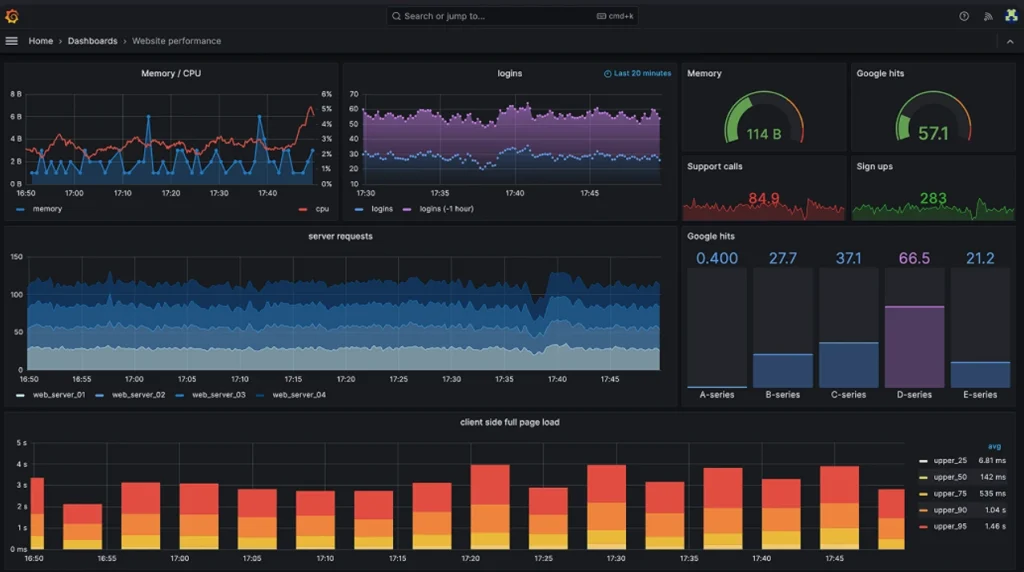
Source: Grafana OSS dashboard example
Best for: Teams willing to trade convenience for control
A lot of engineers love Grafana right up until they become responsible for maintaining the entire stack behind it, and this tension sits at the center of the Grafana ecosystem.
On paper, it solves many of the problems that push teams away from New Relic:
- No vendor lock-in
- No proprietary telemetry model
- No observability seat drama
- Enormous flexibility
- Strong OpenTelemetry support
- Massive community adoption
You can shape the stack almost any way you want. Grafana for dashboards. Loki for logs. Tempo for tracing. Prometheus for metrics. Everything becomes modular.
For the right engineering organization, that flexibility is incredibly powerful. It also means you are now responsible for the observability architecture itself.
Storage decisions, scaling, tuning, retention, performance, integrations, uptime, upgrades. Those problems stop belonging to a SaaS vendor and start belonging to your team.
Some companies are perfectly happy with that tradeoff because it gives them far more control over costs and infrastructure, but others eventually realize they’ve just built themselves a second internal platform to maintain.
Grafana tends to work best in engineering cultures already comfortable owning infrastructure directly.
If your team enjoys customization and wants observability shaped around your environment instead of the other way around, the ecosystem can be fantastic. But if your team mainly wants something polished, centralized, and focused, the maintenance burden becomes much less charming over time.
| Pros | Cons |
| Extremely flexible ecosystem | Significant overhead |
| Strong OpenTelemetry compatibility | Requires infrastructure expertise |
| Large open-source community | Maintenance burden grows over time |
| Avoids proprietary observability lock-in | Longer setup and tuning process |
Enterprise observability platforms
Some environments genuinely need deep infrastructure visibility, telemetry correlation, distributed tracing, and large-scale cloud monitoring. These tools aren’t lightweight replacements for New Relic, and they compete in the same enterprise observability category.
6. Datadog
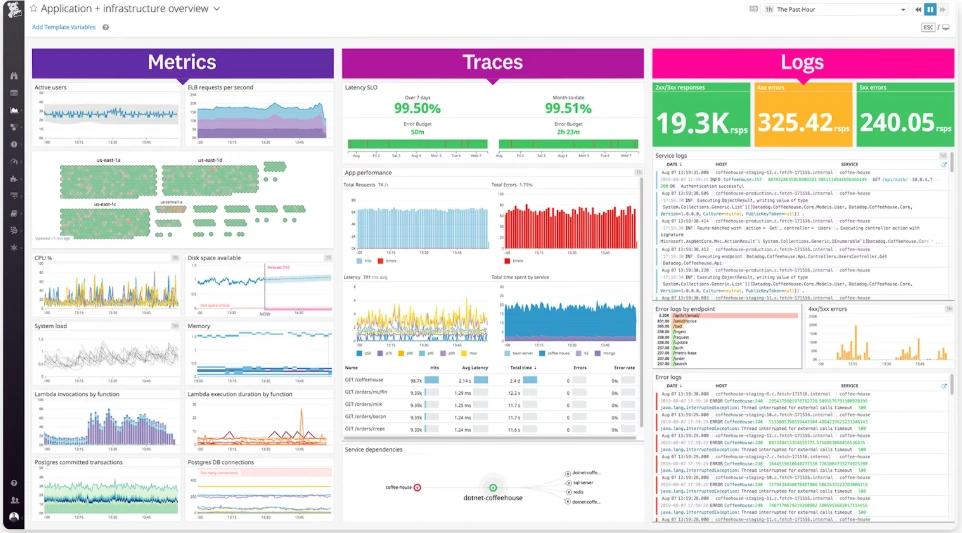
Source: Datadog dashboard example
Best for: Large engineering organizations running complex cloud infrastructure
Datadog usually enters the conversation after teams realize lightweight monitoring isn’t enough for the systems they are operating.
Once infrastructure starts spreading across containers, cloud services, microservices, managed databases, queues, APIs, and distributed applications, observability becomes less about simple uptime checks and more about correlation.
That’s Datadog’s biggest strength.
The platform pulls together:
- Infrastructure monitoring
- APM and distributed tracing
- Log management
- Real user monitoring (RUM)
- Synthetic monitoring
- Kubernetes visibility
- Deployment and service dependency tracking
More importantly, those pieces actually work together coherently.
An engineer investigating a slowdown can move from an application trace into infrastructure metrics, logs, deployment events, container performance, or service dependencies without constantly switching tools and losing context during an incident.
These capabilities are why many infrastructure-heavy companies stay with Datadog despite the pricing complaints surrounding it, and there are a lot of pricing complaints.
Teams frequently underestimate how quickly costs grow once telemetry volumes scale. That creates an awkward reality. Some organizations leave New Relic because observability costs become difficult to justify, then recreate the exact same problem after migrating to Datadog.
Still, companies operating large-scale systems often tolerate those costs because the visibility is genuinely excellent. Datadog isn’t really trying to be lightweight, it’s trying to become the operationsl center of gravity for engineering teams running modern cloud infrastructure.
| Pros | Cons |
| Excellent cross-system visibility | Costs can escalate quickly |
| Strong Kubernetes and cloud-native tooling | Custom metrics and ingestion pricing can become expensive |
| Deep tracing, logs, and infrastructure correlation | Steeper learning curve |
| Large integration ecosystem | Often excessive for smaller teams |
7. Dynatrace
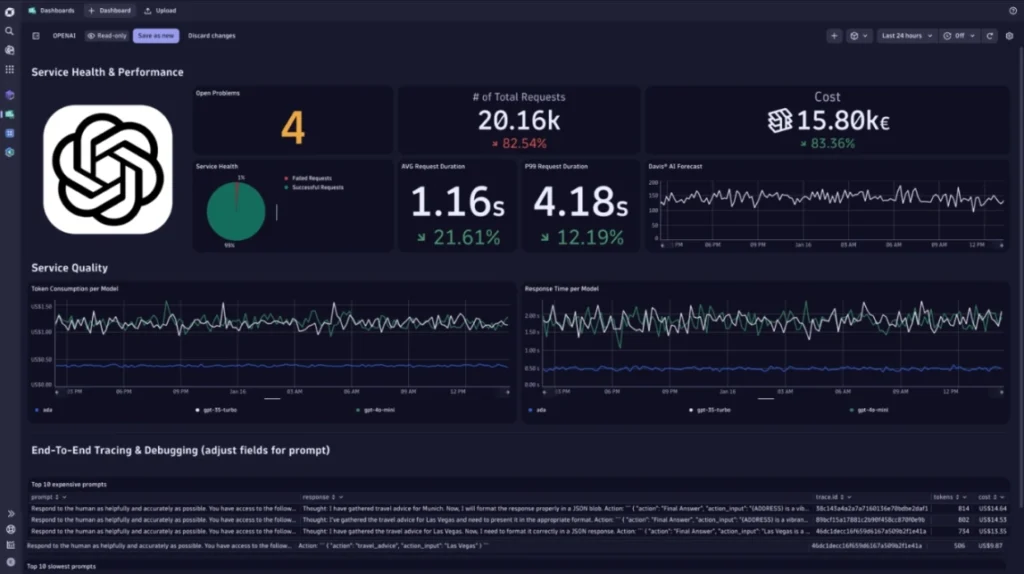
Source: Dynatrace dashboard example
Best for: Enterprise environments where manual debugging is no longer realistic
Dynatrace is built for organizations operating large, complex environments where outages can cascade across applications, infrastructure, cloud services, and dependencies simultaneously.
The platform combines:
- Infrastructure monitoring
- Application performance monitoring (APM)
- Distributed tracing
- Log analytics
- Cloud monitoring
- Real user monitoring
- AI-assisted root-cause analysis
Its biggest differentiator is automation. Dynatrace focuses heavily on correlating telemetry automatically so teams can identify likely root causes faster instead of manually stitching together traces, logs, metrics, and service dependencies during incidents.
That makes the platform particularly attractive for enterprises operating across multiple cloud providers, large microservice architectures, and fragmented infrastructure ownership.
Compared to New Relic, Dynatrace often feels more centralized and less developer-focused. The platform positions observability as a broader operational layer spanning infrastructure, cloud environments, security, and enterprise applications.
The tradeoff is complexity. Dynatrace is not lightweight, inexpensive, or especially simple, and smaller teams may struggle to justify both the platform overhead and enterprise-oriented pricing.
When it comes to organizations running very large systems, though, the automation layer is exactly why Dynatrace remains a top choice.
| Pros | Cons |
| Strong automated root-cause analysis | Premium enterprise pricing |
| Excellent visibility across large systems | Significant platform complexity |
| Powerful AI-assisted observability workflows | Heavy operational footprint |
| Strong fit for large enterprise environments | Overkill for smaller organizations |
Cloud-native monitoring tools
Some teams replacing New Relic already have monitoring tooling sitting inside their cloud environment. Regarding simpler workloads, those built-in services may already cover most needs without adding another observability platform on top.
8. AWS CloudWatch
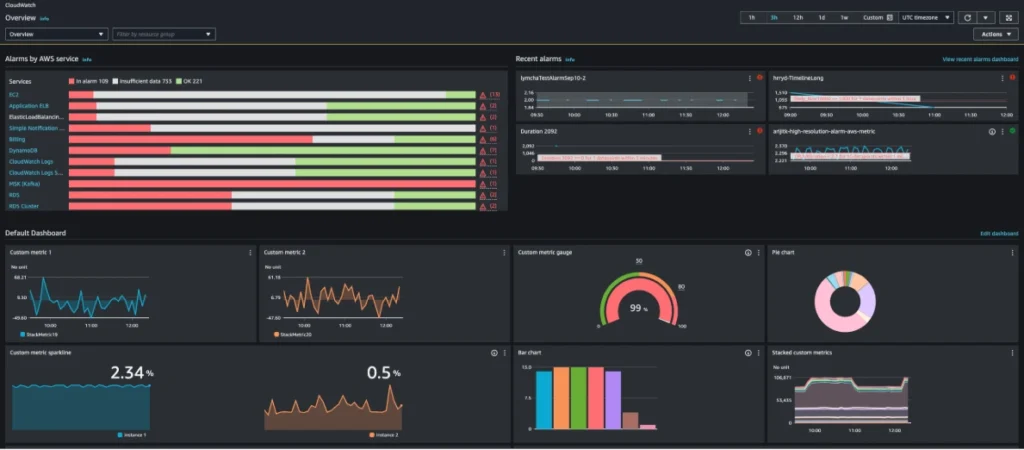
Source: AWS CloudWatch dashboard example
Best for: AWS-heavy teams that want to avoid adding another observability vendor too early
A surprising number of smaller engineering teams already have most of the monitoring tools they need sitting inside AWS. They just assume they need something bigger.
CloudWatch covers a lot more ground than people sometimes realize:
- Infrastructure metrics
- Logs
- Alerting
- Dashboards
- Application monitoring
- Tracing through X-Ray
- AWS service integrations
For teams operating primarily inside AWS, that can be enough for a long time.
The appeal is partly financial, but also operational. There’s no separate observability vendor to manage, no additional telemetry pipeline layered on top of AWS, and fewer moving parts overall. Smaller SaaS products and lean engineering teams often prefer that simplicity.
CloudWatch starts becoming more frustrating once environments grow more distributed.
Cross-cloud visibility is weaker, dashboards and workflows can feel fragmented, and correlating infrastructure issues across larger systems is less elegant than in dedicated observability platforms like Datadog or New Relic.
Still, a lot of organizations jump into expensive observability tooling before they actually need it. CloudWatch is often the reminder that “good enough” monitoring can carry teams surprisingly far when infrastructure remains relatively simple.
| Pros | Cons |
| Deep AWS integration | Multi-cloud visibility is limited |
| No separate observability vendor required | Workflows can feel fragmented |
| Good fit for smaller AWS-native environments | Less polished than dedicated observability suites |
| Can reduce tooling costs significantly | Advanced correlation and analytics are weaker |
9. Azure Monitor
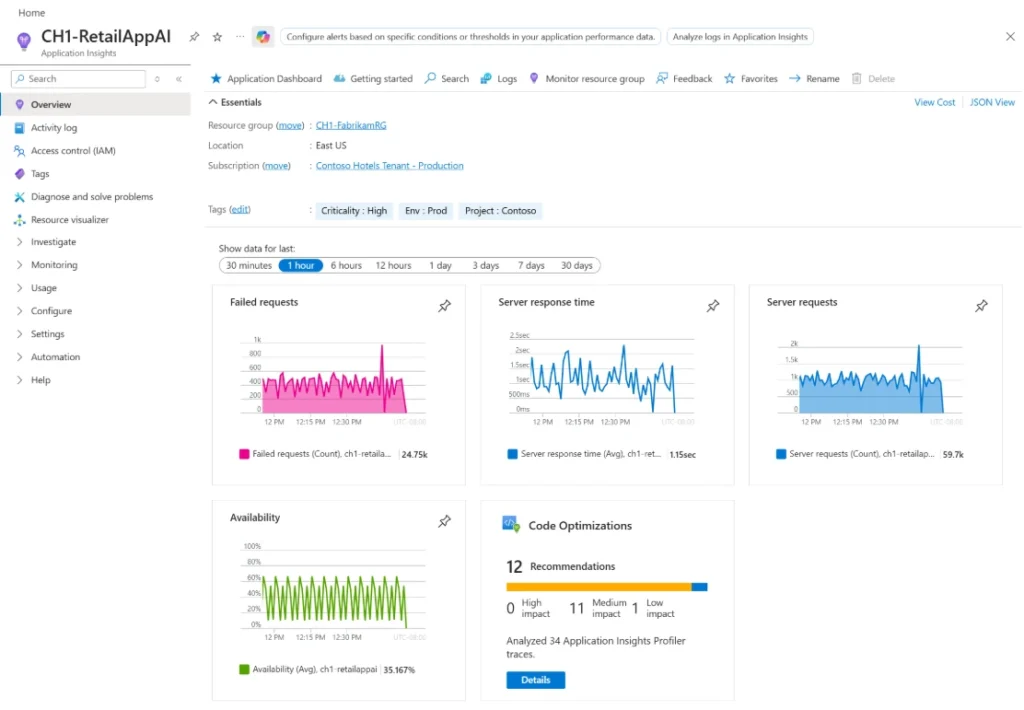
Source: Azure Application Insights example
Best for: Organizations already deeply invested in the Microsoft ecosystem
Azure Monitor makes the most sense when a company has already standardized around Azure, Microsoft services, and .NET-heavy infrastructure.
In those environments, the platform feels less like an extra observability product and more like an extension of the existing cloud stack.
Azure Monitor features:
- Infrastructure monitoring
- Application Insights
- Logging
- Metrics
- Alerting
- Azure service telemetry
The tight ecosystem integration is the main reason teams stick with it.
Microsoft-centric organizations can monitor applications, cloud resources, databases, containers, and infrastructure without introducing another major observability vendor into the mix. Smaller teams can keep tooling and overhead relatively manageable.
The experience becomes less comfortable once infrastructure spreads outside Azure.
Multi-cloud environments, hybrid systems, and more advanced observability workflows expose some of the platform’s rougher edges.
Teams often end up supplementing Azure Monitor with additional tooling once tracing, correlation, or complexity grows beyond what the built-in ecosystem handles elegantly.
There is also the same “good enough” dynamic seen with CloudWatch. Plenty of teams assume they need a massive observability platform when their actual requirements are still relatively modest.
In Azure-native environments, Azure Monitor can cover much more than people initially expect.
| Pros | Cons |
| Strong Azure and Microsoft integration | Less attractive outside Azure-heavy environments |
| Built-in cloud visibility | UI and workflows can become complex |
| Reduces need for additional vendors | Multi-cloud observability is weaker |
| Good fit for .NET and Azure-centric teams | Less polished than premium observability platforms |
How to avoid observability vendor lock-in
One of the biggest shifts in the observability market has been the rise of OpenTelemetry.
Instead of instrumenting applications with vendor-specific agents, many engineering teams now standardize around OpenTelemetry for metrics, traces, and logs. This approach gives teams much more flexibility because telemetry can be routed to different backends without rebuilding instrumentation every time pricing, infrastructure, or priorities change.
That means teams can switch between platforms like SigNoz, HyperDX, Grafana, Datadog, and New Relic without completely reworking how observability data is collected across their environment.
For many engineering teams, that flexibility has become just as important as feature comparisons or pricing discussions.
Next steps
The best New Relic alternative depends heavily on how much observability your environment actually needs.
Teams mainly focused on uptime visibility, alerting, and operational awareness often end up happier with lighter platforms like UptimeRobot.
Engineering-heavy environments that rely on distributed tracing, telemetry, infrastructure correlation, and deep debugging workflows usually gravitate toward platforms like SigNoz, Grafana, Datadog, or Dynatrace instead.
The important part is avoiding unnecessary complexity.
A lot of organizations end up paying enterprise observability costs for workflows they only touch during outages or production incidents. Identifying what your environment genuinely depends on makes it much easier to narrow down the right replacement.
If your team mainly needs reliable uptime monitoring and incident visibility, you can create a free UptimeRobot account and start monitoring websites, APIs, SSL certificates, cron jobs, and infrastructure endpoints in just a few minutes.
-
The best New Relic alternative depends on your needs. UptimeRobot and Hyperping work well for uptime monitoring, while SigNoz, ClickStack, and Grafana are popular choices for teams that still need observability, tracing, and telemetry capabilities. Larger organizations often compare Datadog and Dynatrace instead.
-
Yes. Several New Relic alternatives offer free plans or open-source options. UptimeRobot includes a free plan for uptime monitoring, while Grafana OSS and SigNoz provide open-source observability platforms that can be self-hosted.
-
It depends on how you’re using New Relic. If your primary goal is uptime monitoring, alerting, SSL monitoring, and incident awareness, UptimeRobot can cover those needs with far less complexity. However, organizations that rely on distributed tracing, application performance monitoring (APM), and deep infrastructure analytics will likely need a broader observability platform.