TL;DR (QUICK ANSWER)
We analyzed 286.9 million downtime notifications to see when outages happen most often and what trends appear across large volumes of incident activity. The data showed consistently higher incident levels during the work week, recurring spikes around certain calendar dates, and several internet-scale outages that triggered massive ripple effects across unrelated services.
Most outages feel random when they happen, but when you zoom out far enough, downtime starts looking a lot less chaotic.
Certain days consistently generate more incidents than others, some periods of the year see noticeably higher activity, and even a small handful of internet-scale failures can trigger ripple effects across thousands of unrelated services at once.
To see what patterns become clear at scale, we analyzed 286.9 million downtime notifications recorded across websites, APIs, servers, and infrastructure endpoints.
What emerged was a picture of how modern outages behave and how operational habits, deployment cycles, and shared infrastructure may shape when incidents happen most often.
Key takeaways
- Tuesday recorded the highest average incident volume across the week.
- Weekdays saw roughly 15% more incidents than weekends.
- Friday generated fewer incidents than Monday despite its “risky deployment day” reputation.
- The 1st and around the 18th consistently showed elevated incident activity.
- March and April recorded the highest average incident levels.
- A small number of major outage events had a widespread impact.
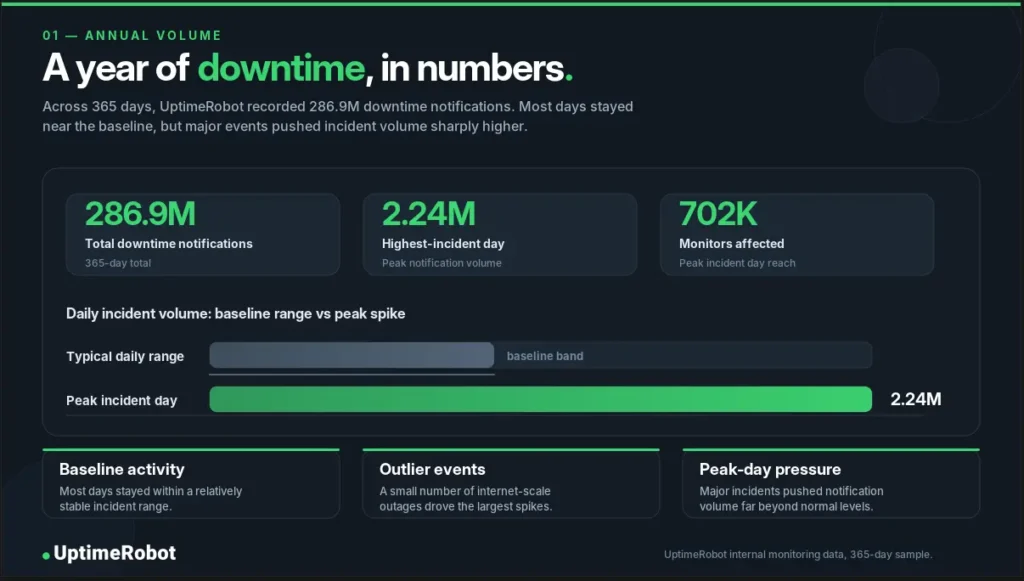
Over 365 days, UptimeRobot recorded 286.9 million downtime notifications. While most days remained within a relatively stable range, several large-scale outage events caused dramatic spikes in activity across monitored systems.
‘Don’t deploy on Fridays’ myth is busted
There’s a long-running assumption in engineering that Friday is one of the riskiest days for deployments and infrastructure changes. However, the data points in the opposite direction.
Friday consistently recorded lower incident activity than most other weekdays. One possible explanation is that many engineering teams already avoid shipping major changes late in the week to mitigate the risk of unresolved incidents carrying into the weekend.
Instead of Friday itself creating more downtime, the data may reflect how deployment behavior has adapted around that concern. Higher-risk changes may simply be getting pushed earlier into the week instead.
Early-week activity makes more incident volume
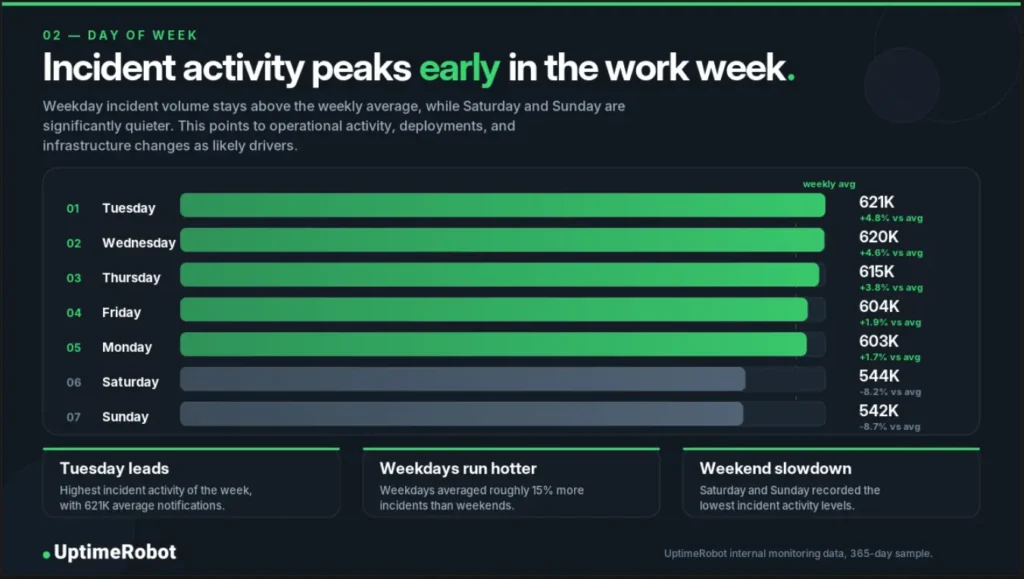
Tuesday recorded the highest incident activity of the week, narrowly ahead of Wednesday and Thursday. Tuesday also appeared in 4 of the 15 highest-incident days in the dataset, suggesting these elevated levels weren’t just isolated spikes.
A potential explanation is the concentration of operational activity earlier in the work week. Deployments, infrastructure updates, backlog clearing, scheduled maintenance, and other system changes often ramp up again after the weekend, increasing the likelihood of incidents being introduced or detected across services.
For engineering teams, the findings reinforce the importance of increased monitoring and incident readiness during periods of heavier operational activity.
Fewer incidents occur on the weekend
Incident activity dropped noticeably over the weekend, with Saturday and Sunday consistently recording the lowest levels in the dataset.
On average, weekends saw around 15% fewer incidents than weekdays. Sunday recorded the lowest overall activity, averaging roughly 542,000 incidents per day.
The quieter weekends probably reflect the slowdown in operational activity outside the standard work week. With fewer deployments, infrastructure updates, and active development cycles taking place, there are simply fewer opportunities for incidents to be introduced across systems and services.
For teams planning maintenance windows or lower-risk operational work, weekends may offer a calmer environment overall.
Days 1 and 18 carry the most risk
Monthly patterns were less pronounced than the day-of-week trends, but several recurring spikes still appeared throughout the dataset.
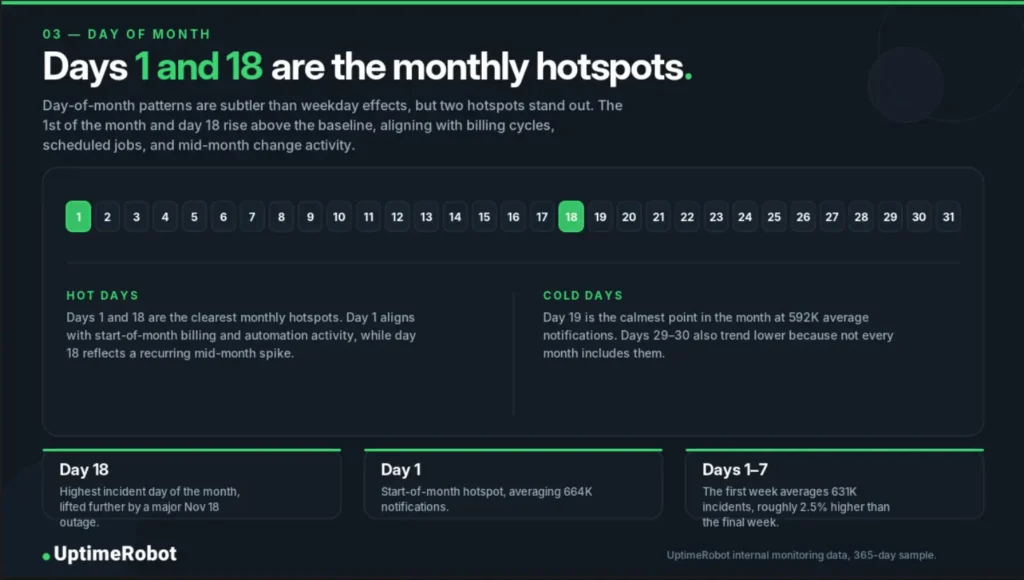
Incident activity tended to increase at the beginning of the month, with Day 1 averaging around 664,000 incidents. Billing runs, reporting jobs, scheduled tasks, and coordinated releases may all contribute to the higher levels seen around the start of new monthly cycles.
Activity increased again around the middle of the month, with Day 18 recording the highest average incident volume. Interestingly, activity then dropped sharply on Day 19, which became one of the quietest days in the dataset.
The swings suggest that recurring system changes and automated processes may cluster unevenly around specific points in the month rather than being spread consistently across the calendar.
The trend also highlights how predictable scheduling patterns can unintentionally create concentrated periods of higher system stress. If your main DevOps or SRE lead suddenly asks for vacation around the 18th, it may be wise to double-check the calendar first.
Spring stands out as the most volatile period
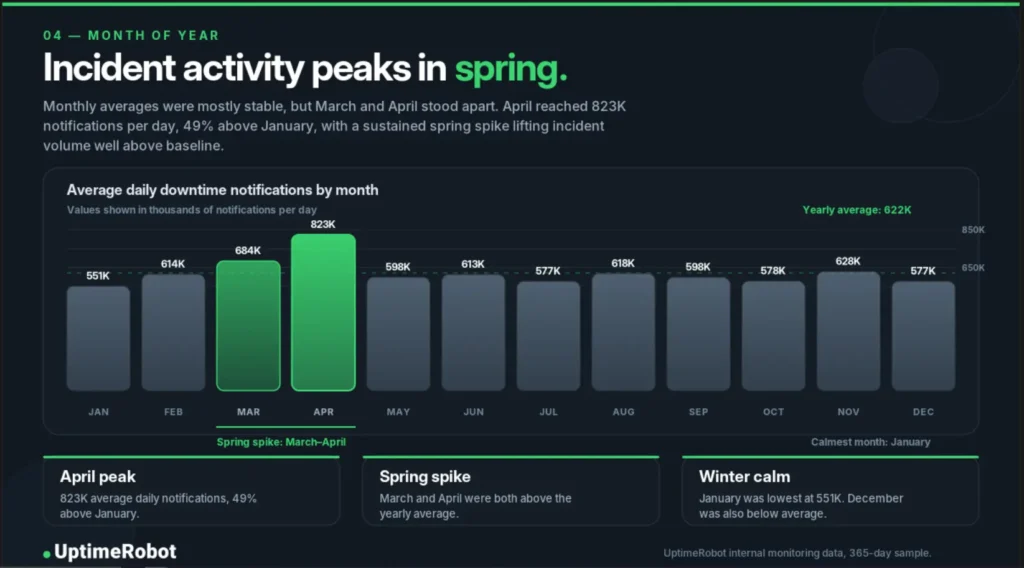
Monthly averages remained relatively stable for much of the year, but March and April stood apart from the rest.
April recorded the highest average incident volume at around 823,000 notifications per day, with March ranking second at roughly 684,000. January recorded the lowest average levels at around 551,000 per day, while December also remained below the yearly average.
Part of the quieter winter period likely shows slower release cycles around the holiday season, when many companies cut back on deployments and infrastructure changes ahead of year-end vacations and the slower January ramp-up that follows.
The heavier spring activity may also have been amplified by several widespread outages affecting widely used platforms and providers throughout the period, including the April 16th Zoom and Spotify disruptions.
Taken together, the findings suggest that periods with heavier infrastructure changes combined with internet-scale outages can greatly amplify incident volume across the broader ecosystem.
Several widespread outages shaped the year
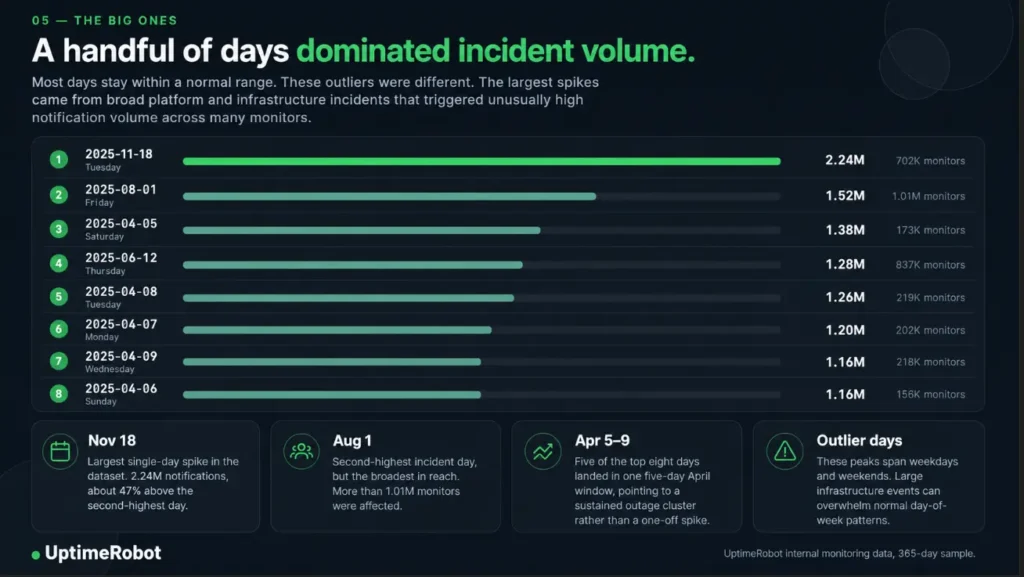
While most days remained within a relatively stable range, a small number of major outages accounted for a disproportionate share of total incident activity.
Several dates stood out clearly in the dataset, many of them aligning with internet-wide disruptions affecting widely used providers and platforms.
November 18
The biggest spike came on November 18th, 2025, when incident volume reached 2.24 million. That day, a major Cloudflare outage disrupted traffic across a wide range of services. Because Cloudflare sits in front of a significant portion of the web, failures at that level can cascade quickly across unrelated platforms and applications.
August 1
Another spike appeared on August 1st, 2025, with 1.52 million incidents and over 1 million monitors affected. Around that time, several large-scale cyber incidents and service disruptions were reported across different sectors. While the dataset doesn’t tie the spike to a single cause, it shows how multiple events can stack and drive activity higher than usual.
April + June
There was also a cluster of elevated activity between April 5th and 9th, with incident volume ranging from 1.16 million to 1.38 million notifications per day. Even Sunday, April 6th reached 1.16 million incidents despite the typical weekend slowdown.
While no single major outage appears to fully explain the spike, the sustained increase suggests that overlapping disruptions across multiple services and providers may have contributed to the heavier incident volume during that period.
June 12th shows a similar pattern, with 1.28 million incidents, aligning with another major Cloudflare outage that impacted multiple widely used services at once.
These spikes show how a small number of high-impact events can shape the overall picture of downtime far more than typical daily activity.
What teams should take away from this
The data suggests that downtime is often tied to predictable operational patterns rather than random chance alone.
Early-week periods consistently recorded heavier incident activity, particularly around deployments, infrastructure updates, and recurring monthly processes. Spreading higher-risk changes more evenly across the week and avoiding large clusters of simultaneous updates can reduce concentrated failure windows.
The findings also reinforce the importance of stronger monitoring coverage during periods of heavier release activity, especially near the beginning of the week and around recurring monthly cycles like billing runs or scheduled reporting tasks.
Large-scale outages remain much harder to control. Several of the biggest spikes in 2025 were linked to failures involving widely used platforms and infrastructure providers, showing how quickly disruptions can cause a domino effect across unrelated services.
That makes dependency visibility increasingly important. Understanding which third-party services sit inside your stack, how alerts are escalated, and where single points of failure exist can make incident response significantly faster when broader outages occur.
Conclusion
Downtime patterns may change throughout the year, but the underlying challenge stays the same. Teams still need to detect issues quickly and respond before they spread across systems and services.
If you want to connect with other engineers and developers, share monitoring setups, troubleshoot problems, stay up to date on product changes, or discuss real-world incidents, join us on the UptimeRobot Discord community.
And if you’re not already using UptimeRobot, you can create a free account to start monitoring websites, APIs, servers, SSL certificates, cron jobs, and infrastructure endpoints in minutes.