Website monitoring tools continuously check whether your website, application, or API is available and responding as expected. Depending on the platform, they can also monitor SSL certificates, domain expiry, page speed, user journeys, and real user performance, then notify your team through email, SMS, Slack, or other channels when something goes wrong.
The market for web monitoring software now splits into four bands: availability checkers, incident-workflow platforms, developer-owned synthetic testing, and full observability suites.
Pick the wrong one and you either overpay for features you’ll never touch or underbuy the visibility you actually need. This website monitoring tool comparison covers 13 tools on price, monitoring depth, and real-world fit.
Key takeaways
- UptimeRobot leads the list for fast uptime monitoring and a strong free plan.
- Better Stack fits teams that want monitoring, on-call, and status pages in one product.
- Checkly is the specialist for monitoring-as-code, with API and browser runs tied to code workflows.
- Pingdom combines uptime, synthetic tests, and RUM, but its pricing can grow fast.
- StatusCake gives agencies broad coverage for the money, including SSL and domain checks.
- Datadog and New Relic make more sense when uptime needs to sit beside full-stack observability.
The 13 best website monitoring tools compared
Before you read the full breakdowns, scan how these 13 tools stack up on price and positioning.
Starting prices below reflect each tool’s entry point, not a ceiling. Enterprise and consumption-based products like Datadog, Grafana Cloud, and New Relic scale with usage, so their number is where the bill starts, not where it ends.
| Tool | Best For | Free Tier | Starting Paid Price |
| UptimeRobot | Fast, affordable uptime monitoring | Yes: 50 monitors, 5-minute checks, no credit card | Starting from ~$9/month |
| Updown.io | Pay as you go uptime monitoring | Yes: 100,000 free credits | ~$5 (credit packs) |
| StatusCake | Broad checks per dollar for agencies | Yes: 10 monitors plus one page-speed, domain, and SSL test | ~$20.41/month (billed annually) |
| Pingdom | Combined uptime, synthetic, and RUM | No | ~$10/month (synthetic) |
| Better Stack | Monitoring plus on-call and status pages | Yes: 10 external monitors | ~$29 per seat/month |
| Uptime.com | Conventional multi-site console for agencies | No | ~$7 to $9/month |
| Oh Dear | Identical feature set on every plan | No (10 day free trial) | €15/month |
| Hyperping | Fast setup, polished status pages | Yes: 20 monitors, 5 minute checks | €29/month |
| Checkly | Developer-owned API and browser testing | Yes: 10 monitors, 1,000 browser runs, 10,000 API runs | $29/month |
| Grafana Cloud Synthetic Monitoring | Teams already standardized on Grafana | Usage-based allowance | Usage-based |
| Site24x7 | Broad monitoring across web, server, and network | Yes: 50 monitors, 30-day trial of paid features | ~$9/month |
| Datadog | Uptime correlated with full-stack telemetry | No free synthetic tier | ~$5 per 10,000 API runs |
| New Relic | Full-stack observability with a generous free tier | Yes: 100GB data ingest/month | Pay-as-you-go beyond that |
What to look for in a website monitoring tool
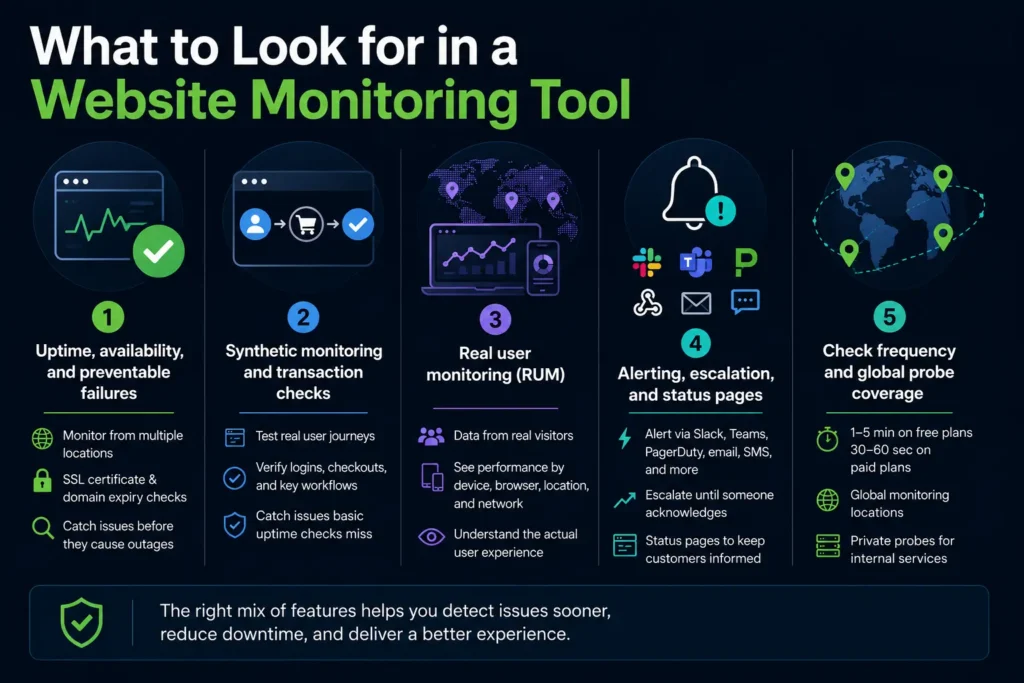
Website uptime and performance monitoring covers a lot more than a simple up/down ping. The right feature set depends on what kind of failure you’re actually trying to catch, and the five criteria below shape every review that follows.
Uptime, availability, and preventable failures
Uptime monitoring checks whether a website or service is reachable and responding as expected over HTTP, HTTPS, TCP, ping, DNS, or keyword matching. Most tools verify failures from multiple locations before sending an alert to reduce false positives.
Many platforms also monitor SSL certificates and domain expiry. These checks catch preventable outages before they affect visitors. Some vendors call this website tracking software, but the principle is the same. The tool checks an endpoint on a schedule and alerts you if something goes wrong.
Basic uptime monitoring tells you whether a site is online. It doesn’t tell you whether key user journeys are actually working.
Synthetic monitoring and transaction checks
Synthetic monitoring scripts browser or API journeys, such as logging in or completing a checkout, and runs them automatically to confirm the entire workflow still works. Unlike uptime monitoring, it verifies that users can complete important actions rather than simply reaching the site.
This matters because a website can appear online while checkout or payment processing has silently failed. Transaction monitoring catches problems that basic uptime checks cannot.
Real user monitoring (RUM)
Real user monitoring collects performance and error data from actual visitors instead of scripted tests. It shows how different browsers, devices, locations, and network conditions affect the user experience.
Synthetic monitoring finds problems before customers encounter them, while RUM shows how real visitors experience your site. Many organizations use both together.
Alerting, escalation, and status pages
Monitoring only matters if the right people know about a problem quickly. Most platforms can send alerts through:
- Slack and Microsoft Teams
- PagerDuty and Opsgenie
- Webhooks and custom integrations
- Email, SMS, and phone calls
Many tools also include status pages for communicating incidents to customers. Status pages don’t detect problems themselves; they provide a central place to publish service health and outage updates.
Check frequency and global probe coverage
Most entry-level plans check websites every one to five minutes, while paid plans often reduce that to 30 or 60 seconds. Faster checks detect failures sooner but typically cost more.
Monitoring locations matter just as much as frequency. Look for tools that check from multiple regions and support private probes if you need to monitor internal services or firewalled applications.
Website uptime and availability monitoring
These tools focus on the fundamentals of website monitoring, including uptime, SSL certificates, domain expiry, response times, and alerting. They’re the best fit for most websites, online stores, and SaaS applications that need fast outage detection without the complexity of a full observability platform.
UptimeRobot
UptimeRobot dashboard
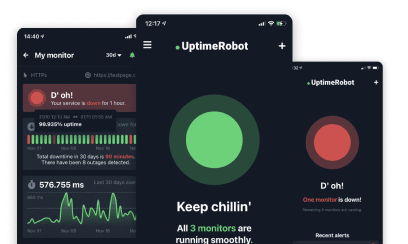
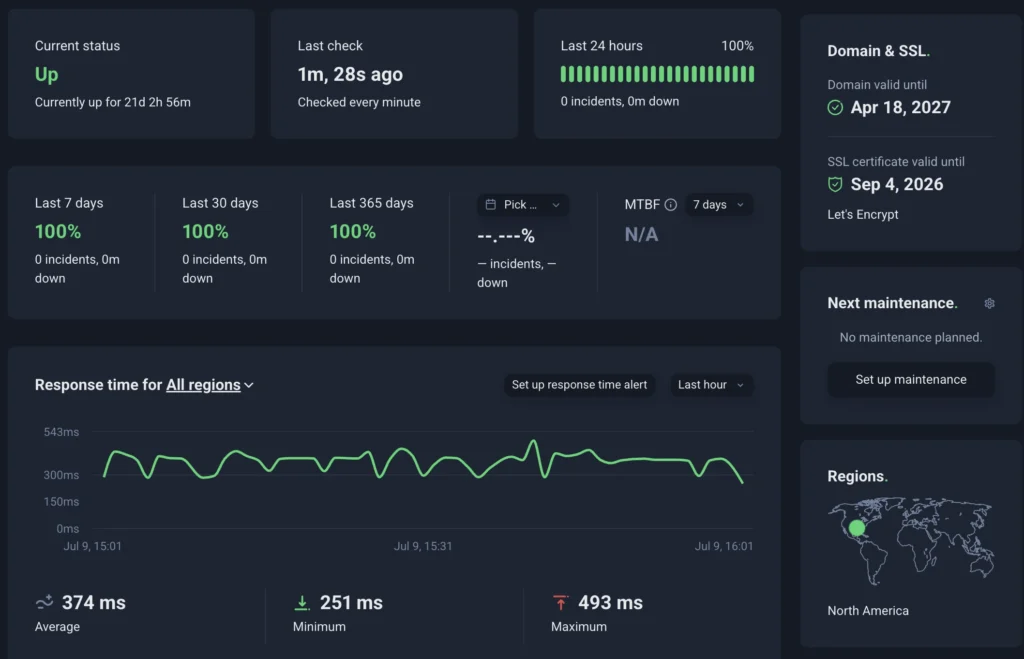
UptimeRobot provides fast, affordable website and service availability monitoring without the complexity of a full observability platform. Its generous free plan, straightforward setup, and predictable pricing make it suitable for everyone from personal websites to enterprise environments.
The free plan includes 50 monitors with 5 minute check intervals, one status page, and around three months of data retention. Paid plans increase monitoring frequency, add more monitors, and unlock advanced alerting and collaboration features.
Key features
- Website, keyword, ping, port, UDP, and API monitoring
- SSL certificate, DNS, and domain expiry monitoring
- Multi-location checks and response time monitoring
- Public status pages
- Email, SMS, Slack, Discord, and other integrations
- Mobile apps for iOS and Android
Paid plans unlock additional monitoring types, faster checks, advanced alerting, status pages, and team features. Plans start at around $9/month, with higher tiers providing additional monitoring capacity and collaboration tools.
Best fit
- Individuals and small businesses that need reliable uptime monitoring
- SaaS teams that want fast alerts without a full observability platform
- Agencies managing multiple websites or client portfolios
- Organizations looking for affordable monitoring that can scale into enterprise plans
| Pros | Cons |
| Generous free plan | Focuses on availability monitoring rather than deep observability |
| Fast setup | Limited synthetic transaction testing |
| Wide range of monitoring types | No built-in real user monitoring (RUM) |
| Affordable pricing |
Want to see how it works before committing? You can create a free account, no credit card required.
Updown.io
Source: Updown.io dashboard
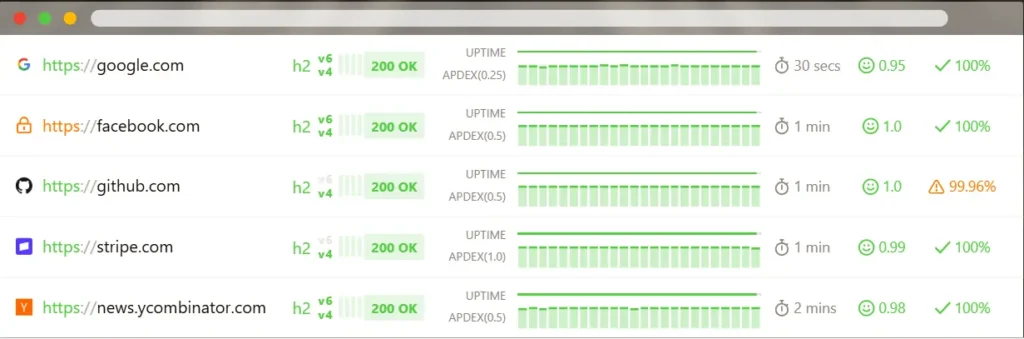
Updown.io is a lightweight website monitoring service with transparent usage based pricing. It supports HTTP(S), TCP(S), and ICMP monitoring, along with SSL certificate, domain expiry, keyword, and heartbeat checks, so it’s a good choice for websites, APIs, and other online services that need reliable uptime monitoring without unnecessary complexity.
Key features
- HTTP(S), TCP(S), ICMP, keyword, and heartbeat monitoring
- SSL certificate and domain expiry monitoring
- Multi-location confirmation to reduce false positives
- Hosted status pages
- Email, Slack, Microsoft Teams, SMS, Telegram, webhooks, and Zapier alerts
- Check intervals from 15 seconds to 1 hour
Pricing
Updown.io uses a pay as you go model based on monitoring frequency instead of fixed plans. New accounts receive 100,000 free credits, and paid credit packs start at €5 with no subscription commitment. The effective monthly cost depends on how often checks run and how many monitors you configure.
Best fit
- Individuals and small businesses
- Developers monitoring websites and APIs
- Teams that prefer usage based pricing over fixed monthly plans
| Pros | Cons |
| Transparent pay as you go pricing | No bundled incident management features |
| Fast checks down to 15 seconds | Usage costs increase as monitoring volume grows |
| Wide range of monitoring types | Limited synthetic transaction testing |
| Hosted status pages |
StatusCake
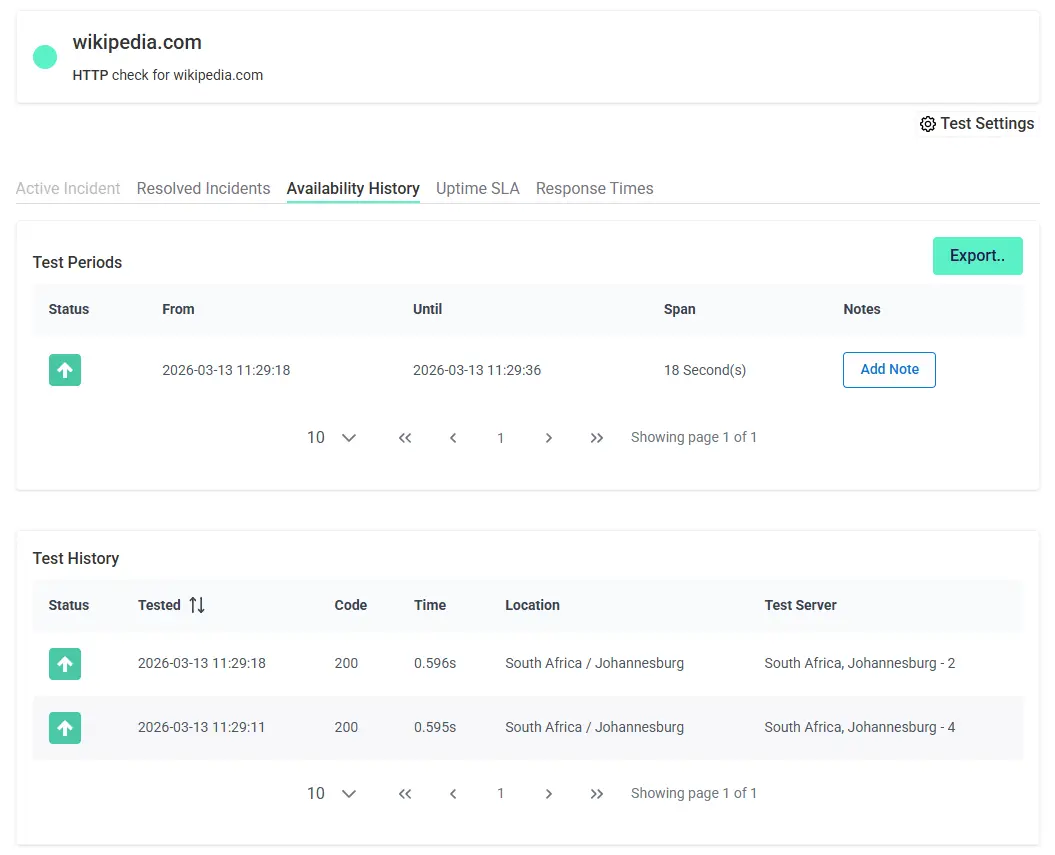
StatusCake dashboard
StatusCake covers website uptime, page speed, SSL certificates, domains, and server monitoring. Its free plan is one of the more generous in this category, while paid plans remain competitively priced for teams managing multiple websites.
Key features
- Website, server, SSL certificate, and domain monitoring
- Page speed monitoring
- Public status pages
- More than 15 third-party integrations
- Multi-channel alerting
Pricing
The free plan includes 10 uptime monitors at five minute intervals, plus one page speed, one domain, and one SSL test. The Superior plan costs $24.49/month or $20.41/month with annual billing and includes 100 monitors with one minute checks. The Business plan costs $74.49 /month or $66.66/month annually and increases the limit to 300 monitors with 30 second checks, along with server monitoring and team features.
Best fit
- Agencies managing multiple client websites
- Small and medium sized businesses
- Teams that want website, SSL, and domain monitoring in one platform
| Pros | Cons |
| Free plan includes uptime, page speed, SSL, and domain monitoring | Interface feels dated compared to newer competitors |
| Good value for agencies managing multiple websites | API is less flexible than some alternatives |
| Website, server, SSL, and domain monitoring in one platform | Development has been slower than some competitors |
Uptime.com
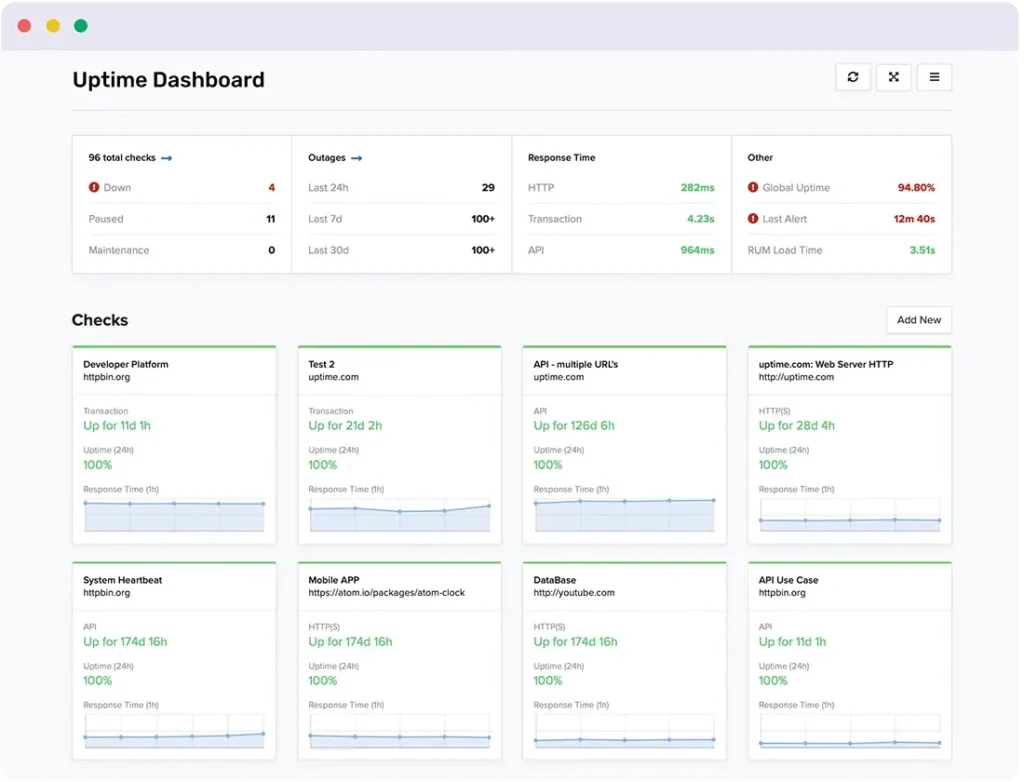
Source: Uptime.com dashboard
Uptime.com monitors websites, APIs, servers, SSL certificates, DNS records, and domains. It also includes synthetic monitoring, status pages, and reporting, making it a good option for agencies and operations teams managing multiple services.
Key features
- Website, API, server, SSL, DNS, and domain monitoring
- Synthetic transaction monitoring
- Public status pages
- Multi-location monitoring
- Reporting and alerting integrations
Pricing
Paid plans start at around $7-9/month, according to independent comparisons. Uptime.com doesn’t offer a free plan, and status pages are priced separately from the core monitoring plans. Before choosing a plan, verify how many monitors, monitoring locations, and synthetic checks are included, as packaging varies across tiers.
Best fit
- Agencies managing multiple websites
- Operations and IT teams
- Organizations that need uptime and API monitoring in one platform
| Pros | Cons |
| Broad range of monitoring types | No free plan |
| Includes synthetic monitoring | Status pages cost extra |
| Suitable for websites, APIs, and infrastructure | Plan limits can be difficult to compare |
| Reporting and status pages | Feature packaging varies between plans |
Oh Dear
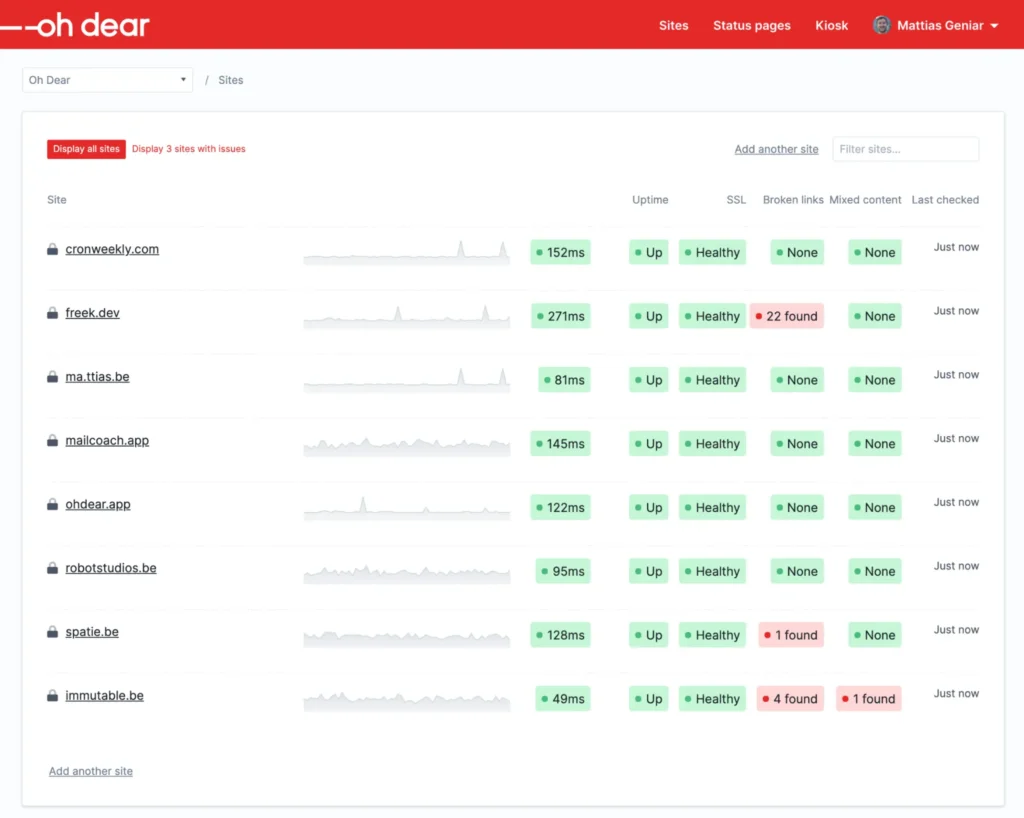
Source: Oh Dear performance monitoring dashboard
Unlike many website monitoring tools, Oh Dear includes the same feature set on every paid plan. Pricing scales only with the number of websites and servers you monitor, so there’s no need to compare feature lists or upgrade plans to unlock additional functionality.
Key features
- Website uptime monitoring
- SSL certificate, DNS, domain, and cron monitoring
- Broken link and mixed content detection
- Public status pages
- Email, Slack, and webhook notifications
Pricing
Plans start at €15/month for two websites and servers. Freelance costs €49/month for 10 websites and servers, Studio €99/month for 25, and Agency €149/month for 50, with larger plans available for bigger portfolios. Every plan includes the full feature set, along with a 10 day free trial that doesn’t require a credit card.
Best fit
- Agencies managing multiple client websites
- Consultants and managed service providers
- Teams that prefer straightforward, feature complete pricing
| Pros | Cons |
| Every plan includes the full feature set | Higher starting price than many uptime monitoring tools |
| Simple site based pricing | Costs increase as you add websites and servers |
| Monitors SSL, DNS, domains, cron jobs, and broken links | No free plan |
| 10 day free trial without a credit card |
Hyperping
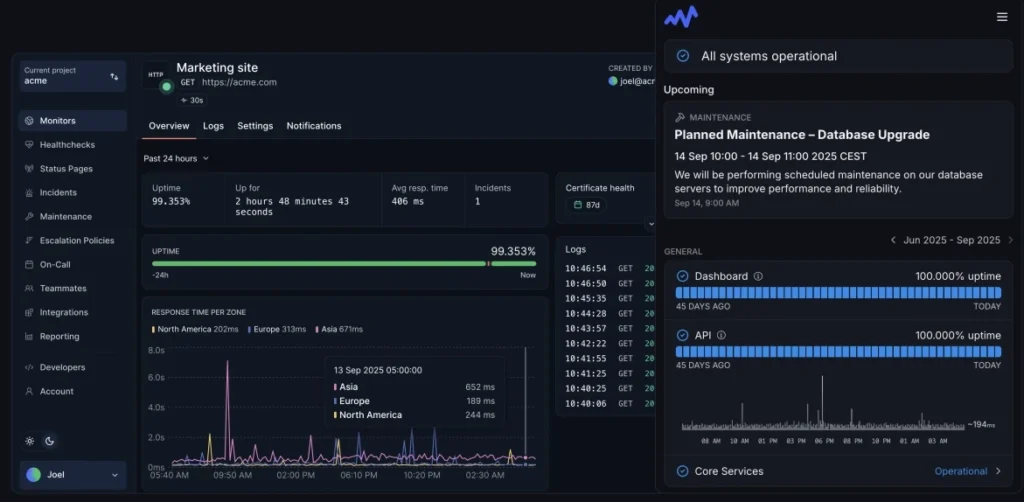
Source: Hyperping dashboard
Startups, SaaS teams, and agencies looking for fast deployment and polished status pages often end up considering Hyperping. It prioritizes ease of use and presentation over deep infrastructure monitoring, making it a good fit for organizations that want reliable uptime monitoring without a complicated setup.
Key features
- Website and API monitoring
- Public status pages
- Multi-location monitoring
- SSL certificate monitoring
- Email, Slack, Discord, and webhook alerts
Pricing
Hyperping offers a free plan with 20 monitors, five minute checks, one basic status page, and one server agent. Paid plans start at €29/month for 50 monitors with 30 second checks, on-call escalations, and custom domain status pages. Higher tiers increase monitor limits, add browser checks, server agents, phone alerts, and SAML SSO.
Best fit
- Startups and SaaS companies
- Agencies managing client websites
- Teams that value quick setup and polished status pages
| Pros | Cons |
| Fast deployment and simple setup | Less mature than long established competitors |
| Modern interface and status pages | Limited infrastructure monitoring |
| Straightforward uptime monitoring | Fewer advanced monitoring capabilities than larger platforms |
| Multi-location monitoring | Pricing and plan limits should be verified |
Website monitoring with synthetic testing
These platforms go beyond basic uptime monitoring by testing browser and API workflows. They’re designed to verify that critical user journeys, such as logging in, searching, or completing a checkout, continue to work as expected.
Pingdom
Source: Pingdom dashboard
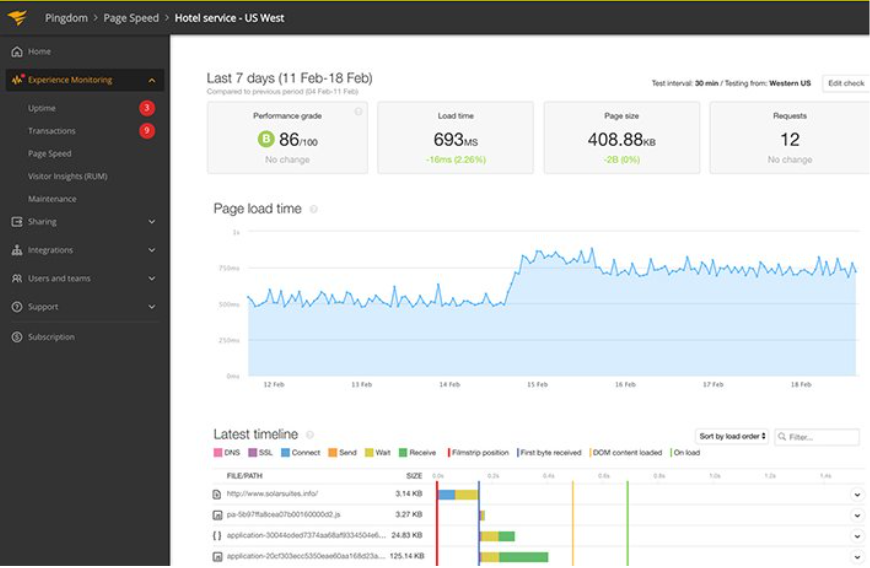
Pingdom has been one of the best-known website monitoring tools for years, and it remains a popular choice for organizations that want uptime monitoring, synthetic testing, and real user monitoring in one service. It’s quite well suited to teams that need both availability monitoring and detailed performance insights without adopting a full observability platform.
Key features
- Website uptime monitoring
- Synthetic transaction monitoring
- Real user monitoring (RUM)
- Public status pages
- Email, SMS, Slack, PagerDuty, and webhook alerts
Pricing
Synthetic monitoring plans start at $10/month, while Real User Monitoring and other services are priced separately based on usage. Instead of fixed monitoring tiers, Pingdom uses a configurable pricing model that varies with features, check volume, and page views, so costs can increase as monitoring requirements grow.
Best fit
- E-commerce websites
- Marketing and digital experience teams
- Organizations that need uptime monitoring alongside synthetic testing and RUM
| Pros | Cons |
| Mature uptime, synthetic, and RUM capabilities | Usage based pricing can be difficult to predict |
| Detailed performance reporting | Costs increase as monitoring volume grows |
| Extensive integrations | Less developer friendly than monitoring as code platforms |
| Long track record |
Checkly
Source: Checkly dashboard
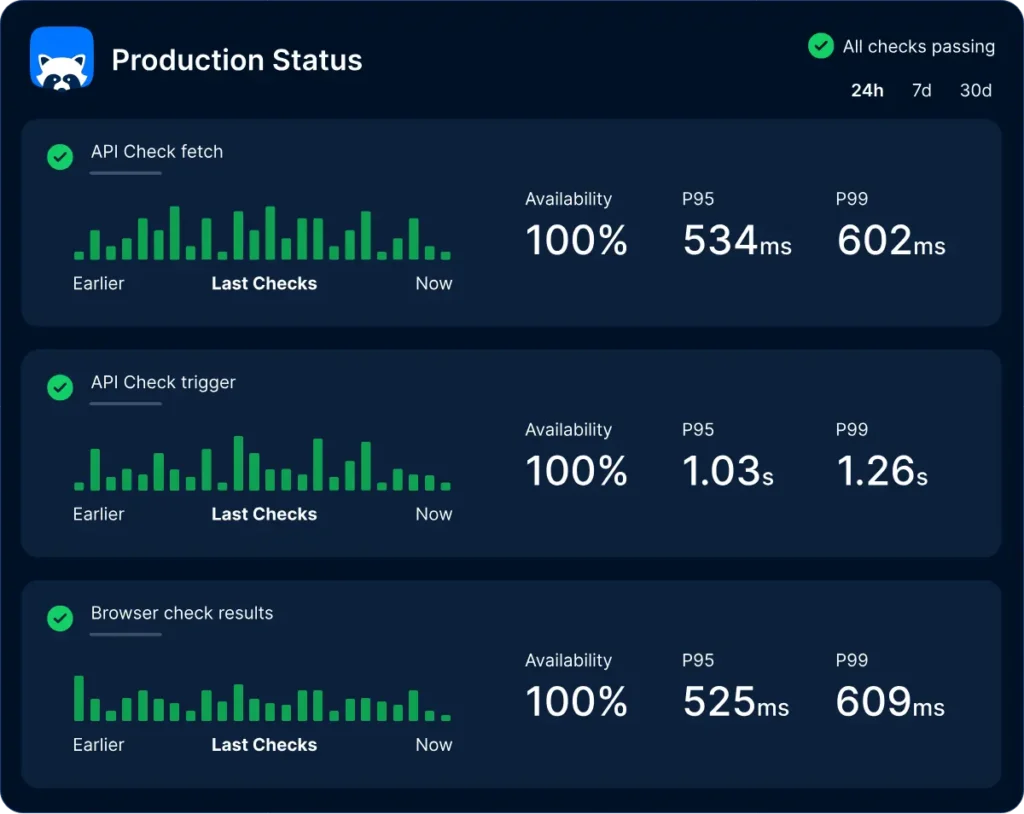
Checkly treats monitoring as part of the development process rather than a separate operations task. Browser and API checks live alongside application code, making it a natural choice for teams already using Git, CI/CD pipelines, and Playwright.
Key features
- API and browser monitoring
- Monitoring as code
- Playwright integration
- Global monitoring locations
- Git and CI/CD integrations
Pricing
The free Hobby plan includes 10 monitors, 1,000 browser runs, and 10,000 API runs per month. Starter costs $29/month (or $24/month billed annually) and includes 50 monitors, while Team costs $80/month (or $64/month annually) for 75 monitors. Browser and API overages are billed separately, so costs increase with usage.
Best fit
- Development teams
- API-first applications
- Organizations using Git based deployment workflows
| Pros | Cons |
| Built for monitoring as code | Usage based overage charges |
| Excellent Git and CI/CD integration | Browser scripts require maintenance |
| Strong API and browser monitoring | Less suitable for non-technical teams |
| Generous free plan | No built-in real user monitoring |
Grafana Cloud Synthetic Monitoring
Source: Grafana OSS dashboard
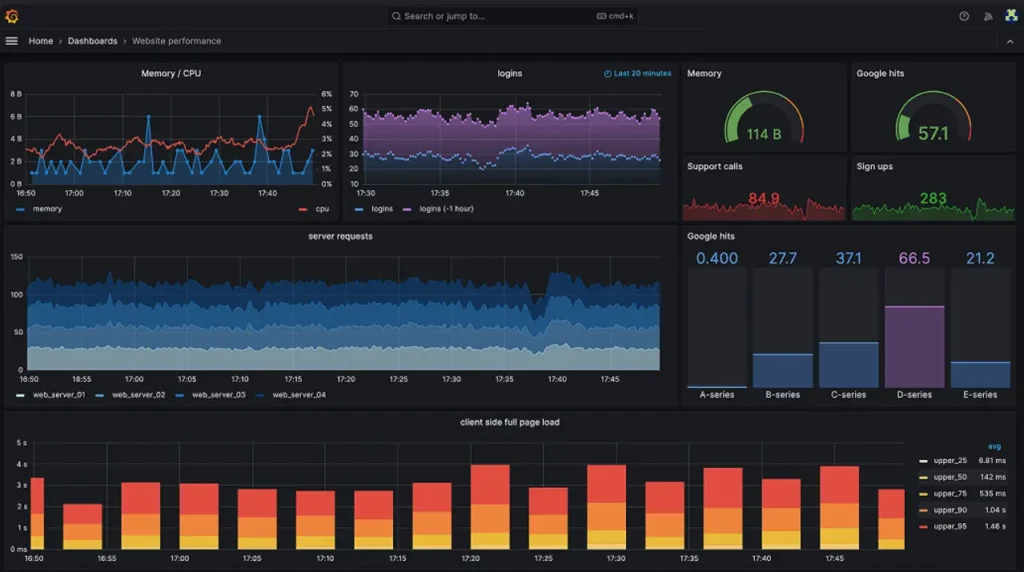
Teams already using Grafana can add synthetic monitoring without introducing another monitoring platform. Browser and API checks feed directly into existing dashboards, alerts, metrics, and traces, providing a single place to investigate application health.
Key features
- Browser and API monitoring
- Public and private probes
- Grafana dashboards and alerting
- Metrics, logs, and traces integration
- Usage based pricing
Pricing
Grafana Cloud Synthetic Monitoring is billed on usage rather than fixed plans. Costs depend on browser and API executions, while private probes require a paid plan. Synthetic monitoring also contributes to Grafana Cloud usage for metrics and log ingestion.
Best fit
- Existing Grafana users
- DevOps and platform engineering teams
- Organizations monitoring internal services with private probes
| Pros | Cons |
| Native Grafana integration | Usage based billing can be difficult to estimate |
| Public and private monitoring locations | Steeper learning curve |
| Fits existing observability workflows | No built-in status pages |
| Flexible browser and API testing | Better suited to technical teams |
Website monitoring for DevOps and IT
Website monitoring is only one part of these platforms. They also cover incident response, infrastructure monitoring, and day to day operations for engineering and IT teams.
Better Stack
Source: Better Stack dashboard
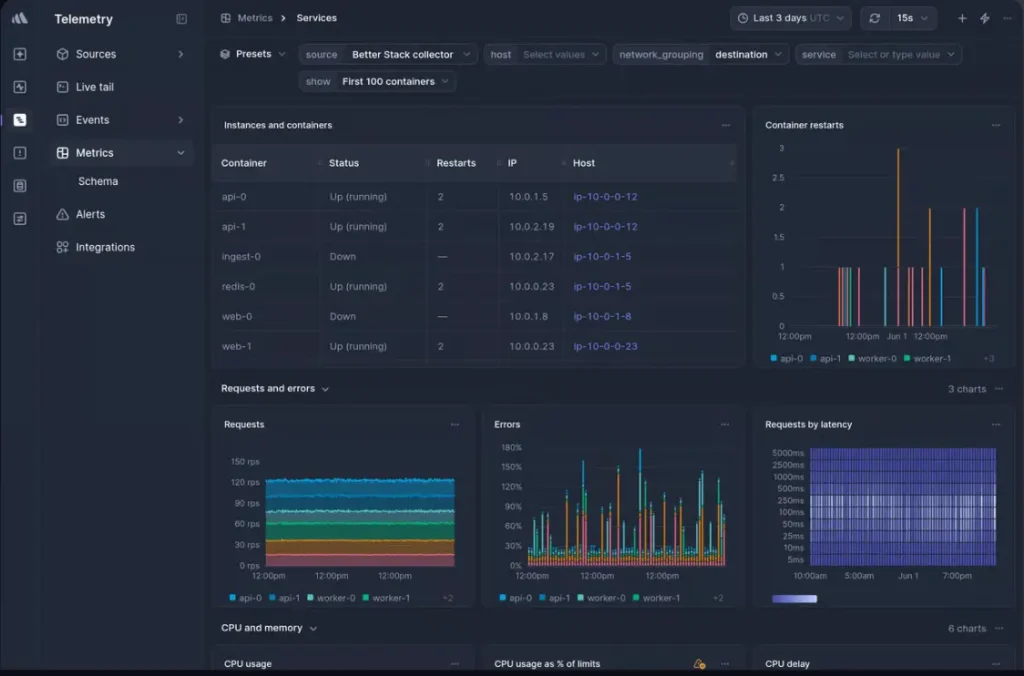
Better Stack started as an uptime monitoring tool but has grown into a complete incident management platform. Alongside website monitoring, it includes on-call scheduling, status pages, incident management, and AI-assisted postmortems, reducing the number of separate tools engineering teams need to manage.
Key features
- Website, keyword, ping, port, DNS, SSL, and mail protocol monitoring
- Multi-location monitoring
- On call scheduling and incident management
- Public status pages
- Slack, Microsoft Teams, Zapier, Terraform, and webhook integrations
- AI-generated postmortems
Pricing
The free plan includes 10 external monitors. Paid plans start at around $29 per responder/month, with monitoring intervals as fast as 30 seconds, unlimited phone and SMS alerts, and additional incident management features. Some products, including logs and telemetry, are priced separately.
Best fit
- Engineering teams
- SaaS companies with on call rotations
- Organizations replacing multiple monitoring and incident response tools
| Pros | Cons |
| Monitoring, on call, and status pages in one platform | Per user pricing increases as teams grow |
| Strong alerting and incident management | Browser monitoring uses consumption based pricing |
| Extensive integrations | More complex than dedicated uptime monitoring tools |
| AI-assisted incident summaries |
Site24x7
Source: Site 24×7 dashboard
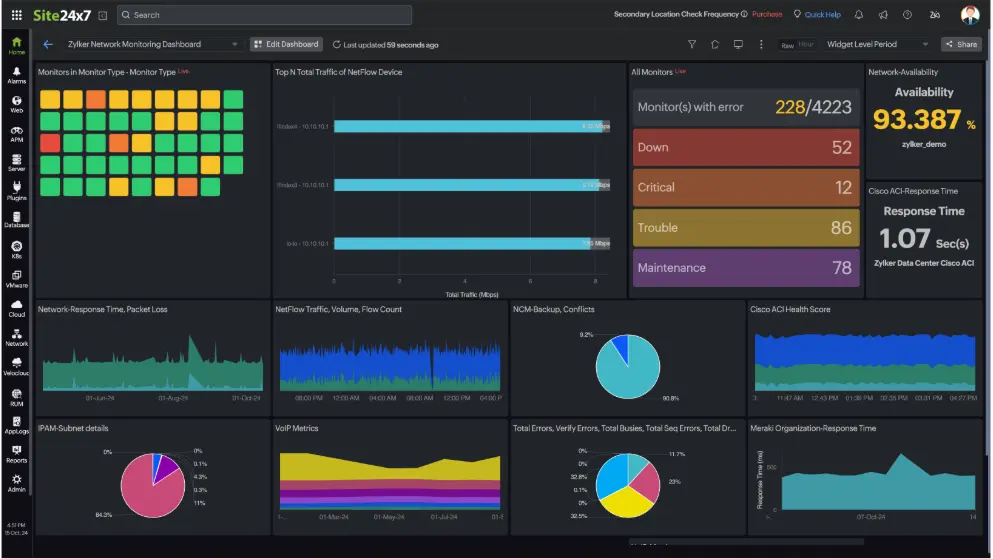
Site24x7 covers much more than website monitoring. Along with uptime checks, it monitors servers, networks, applications, cloud infrastructure, and digital experience, giving IT teams broad visibility without moving to a full observability platform.
Key features
- Website, server, network, and application monitoring
- SSL certificate, DNS, domain, and page speed monitoring
- Cloud and infrastructure monitoring
- Public status pages
- Alerting and reporting
Pricing
The free plan supports up to 50 monitors and includes a 30 day trial of paid features. Paid plans start at around $9/month, with higher tiers adding infrastructure monitoring, digital experience monitoring, and additional capacity.
Best fit
- IT operations teams
- Managed service providers
- Small and mid sized organizations monitoring websites and infrastructure
| Pros | Cons |
| Covers websites, servers, networks, and applications | Interface can feel busy |
| Generous free plan | Features vary between editions |
| Good value compared with enterprise observability platforms | Configuration takes longer than simpler monitoring tools |
| Broad infrastructure monitoring |
Full observability platforms
Website monitoring is only one part of these platforms. They also collect logs, metrics, traces, and application performance data, making them a better fit for organizations that need end to end visibility across their infrastructure and applications.
Datadog
Source: Datadog dashboard
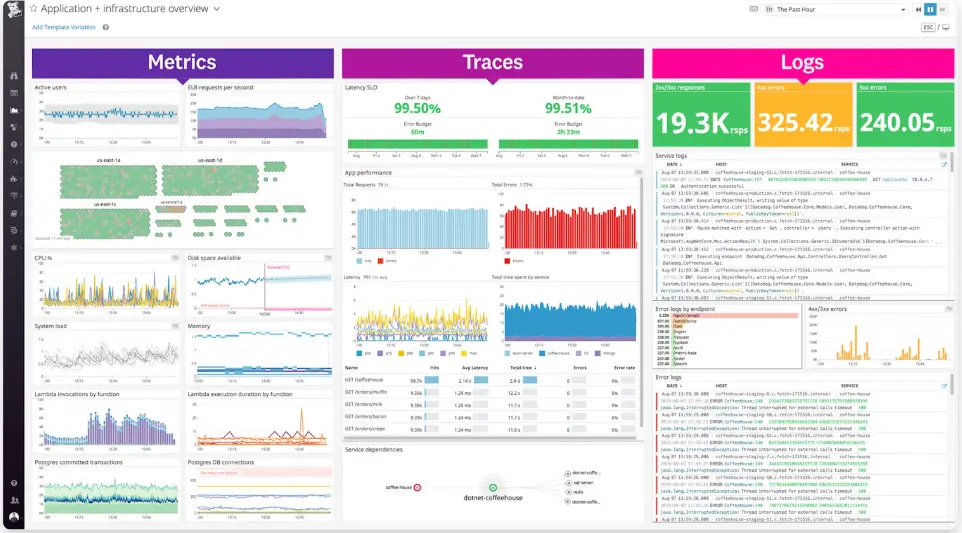
Datadog brings website monitoring into a much larger observability platform. Uptime checks, synthetic monitoring, RUM, infrastructure monitoring, APM, logs, and security all share the same dashboards, making it easier to investigate problems from a single place.
Key features
- Website uptime and synthetic monitoring
- Real user monitoring (RUM)
- Application performance monitoring (APM)
- Infrastructure, logs, and traces
- SLO monitoring
- Slack, PagerDuty, and webhook integrations
Pricing
Datadog does not offer a free synthetic monitoring tier. API monitoring starts at around $5 per 10,000 API test runs, while browser tests, hosts, logs, traces, and other products are billed separately. Overall costs depend on the services you use and monitoring volume.
Best fit
- Large engineering organizations
- DevOps and platform teams
- Organizations already using Datadog for observability
| Pros | Cons |
| Full stack observability platform | No free synthetic monitoring tier |
| Strong synthetic monitoring and RUM | Costs increase across multiple products |
| Extensive integrations | Steeper learning curve |
| Unified dashboards for troubleshooting |
New Relic
Source: New Relic dashboard
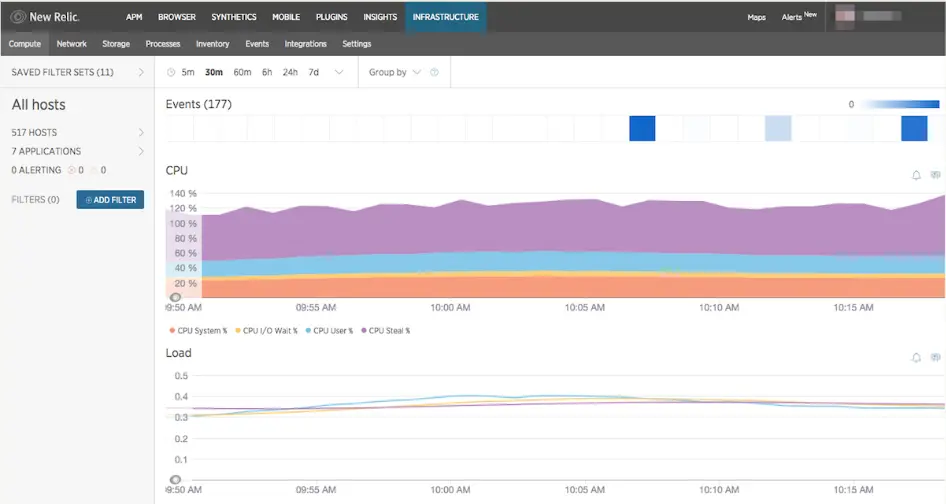
New Relic offers a full observability platform with a free allowance, making it one of the easier ways to start collecting application telemetry without a large upfront investment. As monitoring requirements grow, additional data ingestion and platform services can be added through pay as you go pricing.
Key features
- Website and synthetic monitoring
- Real user monitoring (RUM)
- Application performance monitoring (APM)
- Infrastructure, logs, and traces
- Dashboards and alerting
Pricing
The free plan includes 100 GB of data ingestion per month. Beyond that, New Relic uses usage based pricing for additional data, synthetic monitoring, and platform services.
Best fit
- Development teams adopting observability
- Organizations already using New Relic
- Teams that want a generous free observability tier
| Pros | Cons |
| Generous free data allowance | Usage based costs require careful monitoring |
| Full stack observability | More complex than dedicated uptime tools |
| Strong APM and application monitoring | Can become expensive as data volume grows |
| Flexible platform that scales with usage |
How to choose the right website monitoring tool
Choose the tool that matches what you need to monitor rather than the longest feature list.
Personal websites and small businesses
UptimeRobot, StatusCake, and Site24x7 all offer generous free plans with website, SSL certificate, and domain monitoring, making them good starting points for smaller websites.
Agencies managing multiple websites
StatusCake, Uptime.com, and Oh Dear are all strong choices for agencies. Compare pricing, status pages, reporting, and how costs scale as you add more client websites.
Engineering teams
Better Stack is a good option if you want website monitoring, incident management, and on call scheduling in one platform. Teams already using Playwright or CI/CD workflows should also consider Checkly.
Existing observability users
If you already use Grafana, Datadog, or New Relic, their built in synthetic monitoring is usually the simplest choice because it integrates with your existing dashboards, alerts, and telemetry.
Open source alternatives
If you prefer to self host, Uptime Kuma and Zabbix are two popular options. Uptime Kuma is easy to deploy and supports a wide range of notification channels, while Zabbix provides broader infrastructure monitoring. A hosted service is usually the simpler choice if you don’t want to maintain the monitoring platform yourself.
Next steps
If you’re choosing your first website monitoring tool, start with the monitoring capabilities you need today rather than the longest feature list. A simple uptime monitor is enough for many websites, while synthetic monitoring, real user monitoring, and full observability become more valuable as your applications and infrastructure grow.
Not sure where to begin? Create a free UptimeRobot account and monitor your most important websites, APIs, SSL certificates, and domains in just a few minutes. As your monitoring needs change, you can always add synthetic testing, incident management, or broader observability tools later.
-
Look at five things before you buy: uptime and availability checks, synthetic transaction testing, real user monitoring, alerting and escalation, and check frequency with global probe coverage. Basic uptime checks only confirm a site responds, while synthetic monitoring scripts a full journey like a login or checkout to catch problems a simple ping would miss. Alerting matters just as much as detection, since a failure only helps you if it reaches the right person through the right channel before it turns into a bigger problem.
-
A one-to-five-minute check interval is standard on most entry-level plans, and paid tiers usually drop that to 30 or 60 seconds. Faster checks cost more because they run against more infrastructure, so the right frequency depends on how much downtime you can absorb before it actually hurts your business. Probe location matters too, since checks from multiple regions or real ISP networks help confirm an outage is real rather than a single flaky connection.
-
Yes. UptimeRobot’s free plan covers 50 monitors at five-minute intervals with no credit card required, and StatusCake and Site24x7 also offer solid free tiers with generous monitor allowances. Between them, uptime checks, SSL monitoring, and domain-expiry alerts are covered, which is usually enough for a personal site or a small handful of pages. You can upgrade to faster checks or added features later if your needs grow.
-
UptimeRobot, StatusCake, Uptime.com, and Oh Dear are worth comparing directly for agency use, since they differ mainly in how pricing scales per site and whether status pages come included. Oh Dear keeps the same full feature set on every plan and prices by number of sites, while StatusCake offers a lower cost per site with broad check coverage. The right pick depends on whether you value pricing transparency or the lowest per-site cost more.
-
Pricing varies a lot depending on scope. Availability-focused tools like UptimeRobot, StatusCake, and Site24x7 start in the range of $7 to $9 a month, while incident-workflow platforms like Better Stack charge per seat, often around $29 a month. Full observability suites like Datadog and New Relic price on usage across hosts, logs, and traces, so the bill can grow well past the advertised starting number depending on how much of the platform you actually use.