TL;DR (QUICK ANSWER)
A slow service is not necessarily a down service. If requests are still being served successfully, the service is available and the slowdown should be tracked as degradation rather than downtime. Separating performance from availability keeps uptime reporting accurate.
There’s an important difference between a service that is slow and one that is down, and blurring the two makes your reporting less accurate, not more. A site that responds in three seconds instead of three hundred milliseconds is degraded. It is still up.
It is still serving requests. Counting that as downtime understates your real availability and can make a client report look far worse than the service performed.
This matters for anyone reporting uptime to a customer, a manager, or an SLA. Here’s how to separate degradation from downtime including when a slow response should alert, when it should count as degradation, and when it should not touch your uptime percentage at all.
Key takeaways
- Downtime means requests cannot be served. Degradation means requests succeed but take longer than expected.
- Slow responses should trigger performance alerts without automatically reducing uptime.
- Tracking degradation separately preserves accurate uptime reporting while still highlighting performance issues.
- Confirming outages across multiple monitoring locations helps prevent regional issues from being reported as global downtime.
The core distinction
Downtime is the absence of service. The server does not respond, returns an error that means the request could not be served, or times out. From the user’s perspective, the site is unavailable. This is what an uptime percentage measures: the proportion of time the service was actually available.
Degradation is different. The service is still available, but it responds more slowly than expected. Requests succeed, users get what they asked for, and the site remains usable, even if the experience is slower than normal.
The two often have different causes. Downtime usually points to something broken, while degradation is more often caused by temporary performance issues, such as traffic spikes, slow third party services, a busy database, or network conditions between the monitor and the server.
Treating both as “down” hides those differences and makes it harder to understand what actually happened.
Why slowness and downtime get conflated
The conflation comes from a reasonable instinct. Slow is bad, and down is bad, so treat them the same. But that produces reporting that misrepresents reality.
If any response slower than a threshold counts as downtime, your uptime percentage starts absorbing every transient slowdown. A brief traffic surge that slows responses for a few minutes, without ever making the site unavailable, gets logged as an outage.
Over a reporting period these moments pile up, and the resulting figure describes a service that sounds unreliable when it was available the whole time.
That is how a client report ends up worse than the service deserved. The service was up, but the report says it was down. The gap is entirely an artifact of treating degradation as downtime, and it’s avoidable.
The three states: healthy, degraded, down
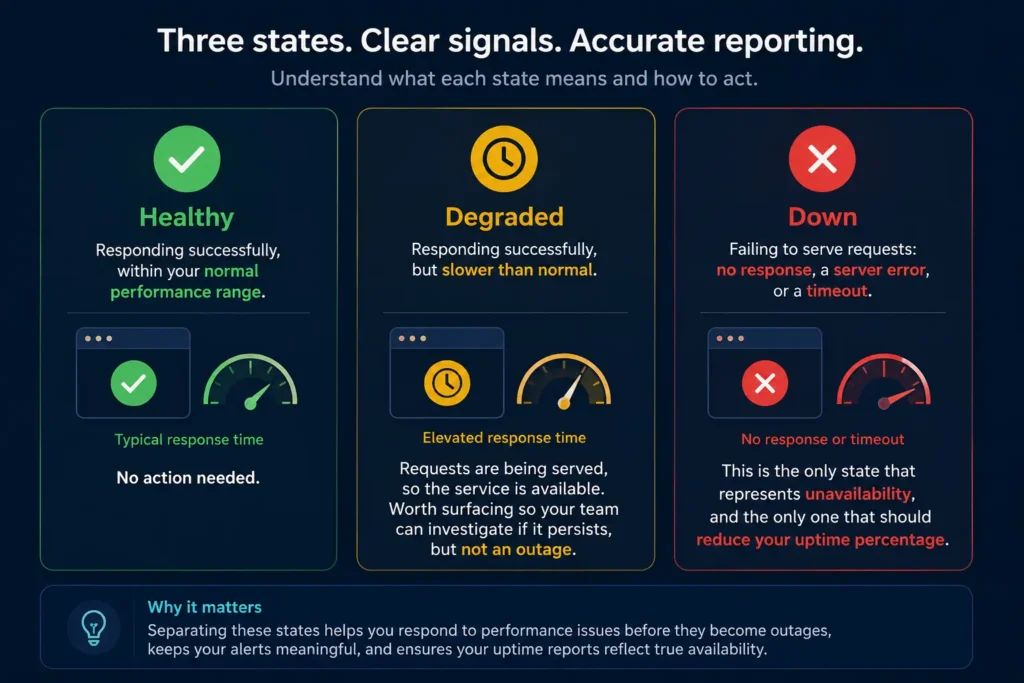
A better approach is to model three states instead of two.
- Healthy. Responding successfully, within your normal performance range. No action needed.
- Degraded. Responding successfully, but slower than normal. Requests are being served, so the service is available. Worth surfacing so your team can investigate if it persists, but not an outage.
- Down. Failing to serve requests: no response, a server error, or a timeout. This is the only state that represents unavailability, and the only one that should reduce your uptime percentage.
Modeling three states is the foundation of accurate reporting. It lets you distinguish between availability and performance instead of treating them as the same problem. That makes alerts more meaningful, uptime reports more accurate, and performance trends easier to understand.
When a slow response should trigger an alert
Slowness is worth an alert when it is meaningful, not every time one check comes back a little slow.
A single slow response is often noise. Network conditions vary, and one elevated reading rarely indicates a real problem. Alerting on every slow check produces a stream of notifications your team learns to ignore, which defeats the point.
Sustained or repeated slowness is different. When response times stay elevated across several consecutive checks, or climb well beyond normal and stay there, that is worth acting on. It suggests something has changed, and catching it early gives you a chance to investigate before it becomes an outage.
So set a response-time threshold that reflects your real expectations, and alert when it is exceeded consistently rather than momentarily. A degradation alert is about early warning and prevention, and it lives alongside your downtime alerting rather than replacing it.
When slowness should be recorded as degradation
Once a slow condition is real but the service is still serving requests, record it as degradation, not downtime.
Doing so gives you a genuinely useful performance history. You can see when the service ran slow, how often, and for how long, and correlate it with traffic, deployments, or external events. That tells you where to invest in performance work and helps you spot trends before they become incidents.
Crucially, recording these periods as degradation keeps them out of your availability figure while still capturing them. You lose nothing. The slow periods are documented and available for analysis; they’re simply logged as what they were, moments when the service was available but slow, rather than mislabeled as unavailable.
When slowness should not affect uptime percentage
If a service is responding successfully, it is available, and available time should not reduce your uptime percentage. Uptime measures whether requests can be served, not how quickly they are served.
A slow response is still a successful response. Track it as a performance issue, but keep it separate from availability so each metric answers a single question.
The exception is when requests are never completed. If a service becomes so slow that requests time out or fail, it is no longer degraded, it is down. The distinction is simple: served requests count as uptime; failed or timed out requests count as downtime.
Why regional slowness is not global downtime
Performance and availability can both vary by location, and a problem seen from one region is not necessarily a problem everywhere.
A service might respond slowly, or briefly fail, from one vantage point while performing perfectly from others, often because of a network issue on a particular route rather than the service itself. Treating that as a global outage overstates the impact.
This is where checking from multiple locations comes into the picture. When several independent locations agree a service is unreachable, you have strong evidence of a genuine outage. When one location sees a problem the others don’t, you likely have a localized network condition.
Using agreement across locations to confirm an outage keeps regional blips from being recorded as global downtime.
Reporting it accurately to clients
Uptime reports should reflect availability, not performance. Separating degradation from downtime keeps your uptime percentage accurate while still giving you visibility into slowdowns.
Track response time alongside availability, confirm outages across multiple monitoring locations, and record slow but successful requests as degradation rather than downtime. Each metric tells a different part of the story.
When performance and availability are measured separately, your reports become easier to understand, easier to trust, and much more useful for troubleshooting.
Build more accurate uptime reports
UptimeRobot monitors availability and response time independently, so you can investigate performance issues, confirm real outages, and report uptime with confidence.
-
Generally no. If the site is responding to requests successfully, it is available, even if slower than normal. That is degradation, not downtime. Downtime is when requests are not served at all: no response, an error, or a timeout. A slow but successful response should be tracked as a performance issue, not counted against uptime.
-
Only when slowness becomes severe enough that requests time out and are never served, which makes the service effectively unavailable. A response that is slow but ultimately successful means the service was available and should not reduce uptime. The test is whether the request was served.
-
Degradation is service that is available but slower than normal, with requests still succeeding. Downtime is service that is unavailable, where requests fail, error, or time out. Degradation is often external and transient, like a traffic spike or a slow dependency; downtime usually means something is broken. Track them as separate states.
-
When it is sustained or repeated, not a single isolated reading. One slow check is often network noise. Response times that stay elevated across several consecutive checks, or climb well beyond normal and remain there, are worth an alert as early warning of a real performance problem, ideally before it becomes an outage.
-
Track availability and performance separately. Log slow-but-successful periods as degradation rather than downtime, set response-time thresholds that alert on sustained slowness without counting it against uptime, and confirm outages across multiple locations so regional blips are not recorded as global downtime.