Better Stack combines uptime monitoring, status pages, incident management, log management, and observability tools in a single platform. That broad feature set makes it a popular choice for teams that want to manage operational workflows from one place.
The challenge is that Better Stack covers a lot of ground. A company looking for affordable uptime monitoring is likely comparing a very different set of tools than an engineering team searching for enterprise observability or advanced incident response workflows.
This article compares the best Better Stack alternatives across uptime monitoring, status pages, incident management, observability, and self-hosted monitoring.
Key takeaways
- Teams often evaluate alternatives because of pricing, self-hosting requirements, feature overlap, or the need for deeper observability capabilities.
- UptimeRobot, Hetrix Tools, Hyperping, StatusCake, and Pingdom are strong options for uptime monitoring and smaller budgets.
- PagerDuty, Incident.io, and Instatus focus on incident response workflows and status page management.
- Datadog, New Relic, Splunk, OneUptime, and Grafana provide broader observability across infrastructure, applications, logs, and metrics.
- Uptime Kuma and Grafana are popular choices for teams that prefer self-hosted or open-source monitoring solutions.

Why are teams moving away from Better Stack?
Better Stack has built a strong reputation. Reviews frequently praise its user interface, ease of use, and broad feature set.
However, other reviews across G2, Capterra, Gartner Peer Insights, and several industry comparisons highlight a few recurring reasons teams start exploring alternatives.
Costs rise as usage increases
Pricing is one of the most common criticisms mentioned in user reviews. While Better Stack’s free plan is generally well received, some reviewers feel the jump to paid plans can be difficult to justify for smaller teams.
One G2 reviewer described the entry-level paid tier as “very steep” for small projects, while another noted that they would like pricing to be “more startup-friendly” and that a lower-cost option would make the platform more attractive for smaller organizations.
Similar concerns are raised in pricing analyses published by Nurbak and CubeAPM, which point to higher costs as log volumes and monitoring needs increase.
Free plans come with notable limitations
Another recurring complaint is that features such as webhooks, custom domains, analytics integrations, SMS alerts, and advanced status page customization are only available on paid plans.
Reviewers frequently mention limitations within the free tier and the need to upgrade sooner than expected. For small businesses, startups, and side projects, this can make the free plan feel restrictive compared to some alternatives.
Log management trails dedicated platforms
While Better Stack has expanded beyond uptime monitoring, some users report that its logging capabilities are not as mature as dedicated observability platforms.
Reviews on G2 mention slower log searches and limitations compared to dedicated logging and analytics tools. Similar observations appear in alternatives roundups from OneUptime and Hyperping, which note that teams with more advanced observability requirements often move toward specialized platforms.
There is no self-hosting option
Better Stack is a fully managed SaaS platform. Many teams find this to be an advantage, but organizations with strict compliance requirements, data residency concerns, or internal infrastructure policies often prefer self-hosted alternatives.
The lack of a self-hosted deployment option is a common theme in comparisons published by OneUptime, Hyperping, and Designmodo.
Monitoring needs become more specialized
As infrastructure becomes more complex, some organizations start looking for capabilities such as application performance monitoring (APM), distributed tracing, advanced metrics analysis, broader integrations, or centralized monitoring across multiple teams.
This doesn’t make Better Stack a poor choice. Rather, it reflects a common progression where teams start with uptime monitoring and status pages, then move toward more specialized tooling as their requirements evolve.
Comparisons often position Better Stack as a strong all-in-one platform that some teams eventually outgrow as their monitoring and observability needs expand.
Quick comparison
If you’re short on time, the table below highlights the main differences between the most popular Better Stack alternatives.
| Platform | Best for | Starting price | Main advantage over Better Stack |
| UptimeRobot | Uptime monitoring | Free (Paid from ~$9) | Simpler pricing and dedicated uptime monitoring |
| Hetrix Tools | Budget uptime monitoring | Free | Lower cost and blacklist monitoring |
| StatusCake | Website monitoring | Free | Performance monitoring and page speed features |
| Pingdom | Uptime + performance monitoring | Paid | Strong synthetic monitoring and RUM capabilities |
| Instatus | Status pages | Free (Paid from $15) | Easier and more customizable status pages |
| PagerDuty | Incident management | Free (Paid from $21/user) | More advanced escalation and on-call workflows |
| Incident.io | Slack-based incident response | Paid | Incident management built around Slack |
| Datadog | Enterprise observability | Paid | Deeper infrastructure, logs, and APM monitoring |
| New Relic | Full-stack observability | Free / Paid | More mature observability and telemetry capabilities |
| OneUptime | Open-source observability | Free (self-hosted) | Self-hosted deployment and open-source flexibility |
| Grafana Cloud | Observability platform | Free / Paid | Greater dashboard flexibility and open-source ecosystem |
| Uptime Kuma | Self-hosted uptime monitoring | Free | Lightweight self-hosted monitoring |
To make the comparison easier, we’ve grouped the best Better Stack alternatives by the scenarios where they perform best, from budget-friendly uptime monitoring tools to enterprise observability platforms and open-source monitoring stacks.
For pure uptime monitoring
If your main priority is knowing when a website, API, server, or service goes down, a dedicated uptime monitoring platform is often a simpler and more cost-effective choice.
These tools focus on uptime monitoring, alerts, and status visibility, making them popular options for startups, small businesses, and teams working within tighter budgets.
UptimeRobot
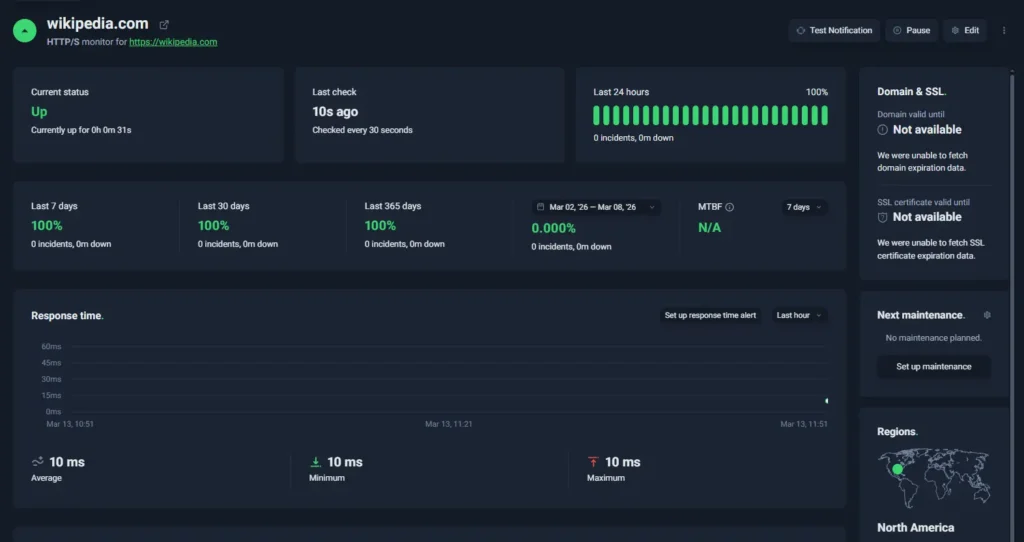
UptimeRobot dashboard
UptimeRobot is a focused uptime monitoring platform designed to detect downtime quickly and alert you before users notice issues.
When compared with Better Stack, UptimeRobot concentrates on one core job: reliable uptime monitoring and fast alerts.
That focused approach makes it easier to set up, simpler to operate, and more affordable for teams that primarily need to monitor websites, APIs, and services for availability.
Key features:
- HTTP(s), ping, port, keyword, and cron job monitoring
- SSL certificate and domain expiration monitoring
- Public status pages with custom branding
- Real-time alerts via email, SMS, voice call, push, and integrations
- 20+ integrations including Slack, Discord, Telegram, and webhooks
- Clean dashboard for managing monitors and reviewing incidents
UptimeRobot has also expanded beyond its SMB roots with an Enterprise plan that includes SSO, SCIM provisioning, audit logs, advanced permissions, and dedicated support for larger teams.
It also offers one of the largest free monitoring tiers in the uptime monitoring market.
Free plan: 50 monitors with 5-minute check intervals
Solo plan: starts around $9 per month
Team plan: starts around $33 per month with additional monitors and users
Pricing scales primarily based on monitor count and monitoring frequency, which keeps costs predictable for growing teams.
Beyond monitoring, UptimeRobot also provides several free utilities and learning resources for developers and operations teams.
Free tools, no account required:
- Subnet calculator for network planning
- Website change detection to track page updates
- MX lookup for verifying email server configuration
- Crontab generator for creating cron expressions
- Uptime calculator to estimate service availability
There is also a Knowledge Hub with tutorials and monitoring guides, along with an active Discord community where users can ask questions, share setups, and discuss monitoring strategies.
Best fit for:
- SaaS teams monitoring websites or APIs
- Product teams needing fast downtime alerts
- Startups that want reliable monitoring with predictable pricing
- Developers who want quick setup without managing complex observability tools
Want to see how it works in practice?
You can create a free UptimeRobot account and start monitoring up to 50 websites, APIs, or services with 5-minute checks. It only takes a few minutes to set up your first monitor.
| Pros | Cons |
| Very fast setup with minimal configuration | No built-in log management |
| Forever free plan with 50 monitors | Limited observability compared with full monitoring platforms |
| Clean dashboard that is easy to navigate | Fewer advanced incident management features |
| Wide range of notification channels and integrations |
Hyperping
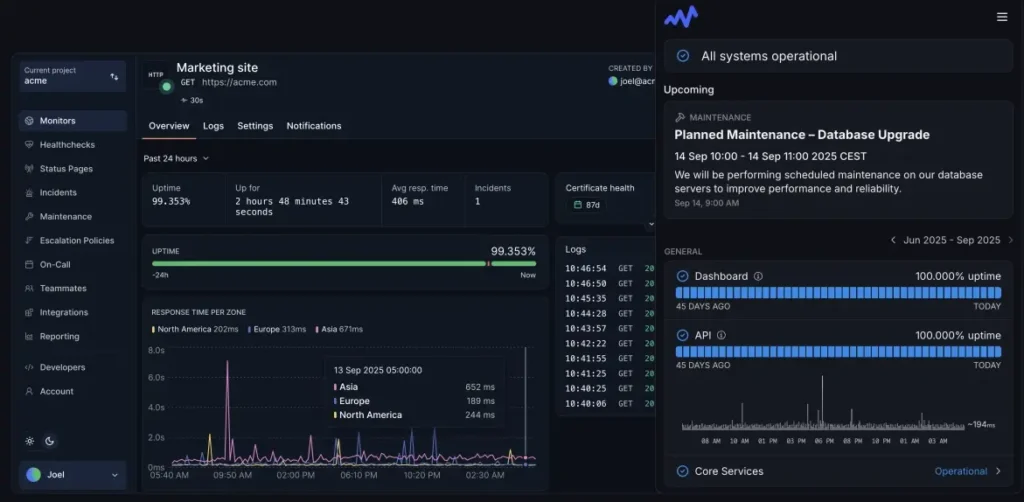
Source: Hyperping dashboard example
Hyperping is an uptime monitoring platform that helps teams detect downtime quickly and respond to incidents before they affect users.
Similar to Better Stack, Hyperping combines uptime monitoring, alerts, and status pages in a single platform. However, it focuses more narrowly on availability monitoring rather than broader observability features like logs and tracing.
The platform emphasizes fast alerting, clean dashboards, and developer-friendly integrations, making it a good option for teams that want reliable monitoring without managing a full observability stack.
Key features:
- HTTP(s), ping, and keyword uptime monitoring
- Public and private status pages
- Incident alerts via email, Slack, PagerDuty, and webhooks
- Global monitoring locations
- Integrations with common developer tools
- Clean dashboard for monitoring uptime and incidents
Hyperping offers a free plan with limited monitors, while paid plans start around $24 per month (first 2 months free on annual plan) depending on monitor count and alerting features.
Best fit for:
- SaaS startups monitoring uptime and availability
- Dev teams that want monitoring and status pages in one tool
- Teams that want faster setup than large observability platforms
| Pros | Cons |
| Clean interface and easy setup | Smaller feature set than full observability platforms |
| Combines uptime monitoring with built-in status pages | Free plan has limited monitors |
| Good alerting and integrations with developer tools | Pricing can increase as monitor counts grow |
| Global monitoring locations | Fewer monitoring types than some competitors |
Small teams and startups often prefer monitoring tools that are easy to set up, affordable, and focused on core uptime alerts rather than full observability platforms.
Hetrix Tools
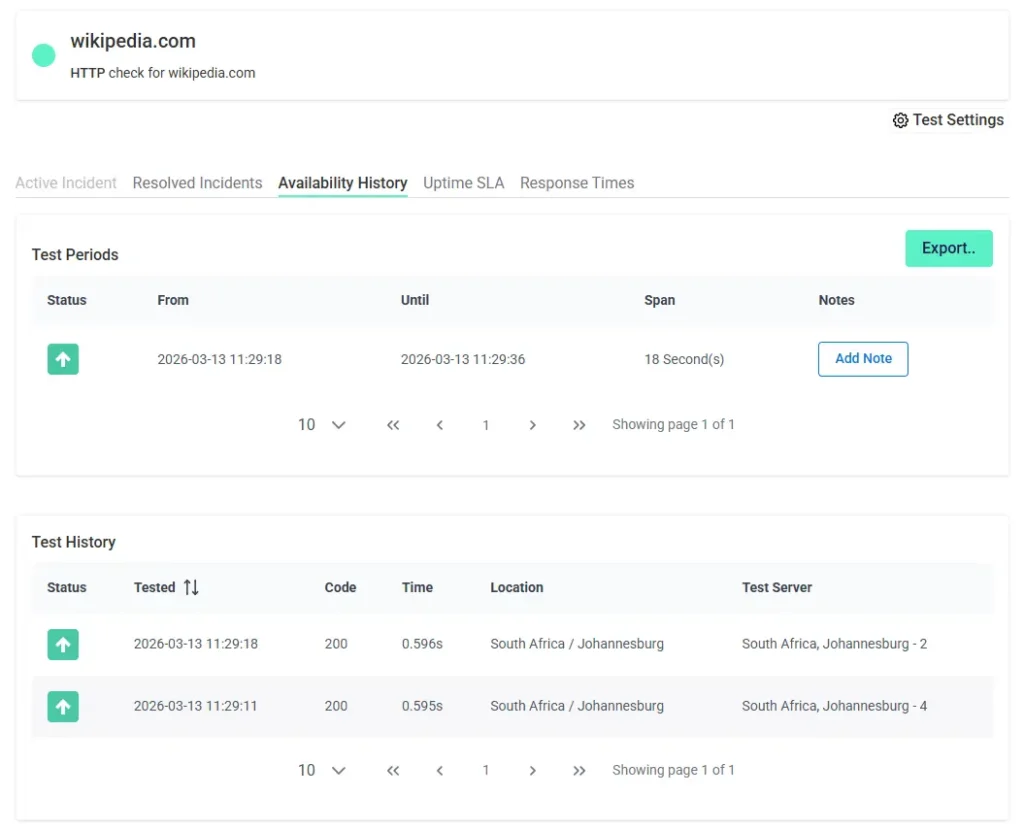
Hetrix Tools dashboard
Hetrix Tools focuses on uptime monitoring, server monitoring, and blacklist monitoring. It doesn’t try to provide a full observability platform with log management and incident response workflows. Instead, it concentrates on monitoring availability, infrastructure health, and domain or IP reputation.
One feature that helps Hetrix Tools stand out is blacklist monitoring. In addition to tracking uptime, it can monitor domains and IP addresses across multiple blacklists.
Key features:
- HTTP(s), ping, TCP, and port monitoring
- Blacklist monitoring for domains and IP addresses
- SSL certificate monitoring
- Domain expiration monitoring
- Public status pages
- Server monitoring via monitoring agents
- Email, SMS, Slack, Telegram, and webhook alerts
Hetrix Tools offers a free plan with 15 uptime monitors and paid plans starting at approximately $9.95 per month. All plans include 1-minute monitoring intervals.
Best fit for:
- Small businesses looking for affordable uptime monitoring
- Hosting providers and infrastructure teams
- Organizations that need blacklist monitoring alongside uptime checks
| Pros | Cons |
| Affordable monitor-based pricing | No log management capabilities |
| Includes blacklist monitoring | No APM |
| 1-minute checks on all plans | Fewer observability features than Better Stack |
| Domain and SSL monitoring included | No self-hosted deployment option |
StatusCake
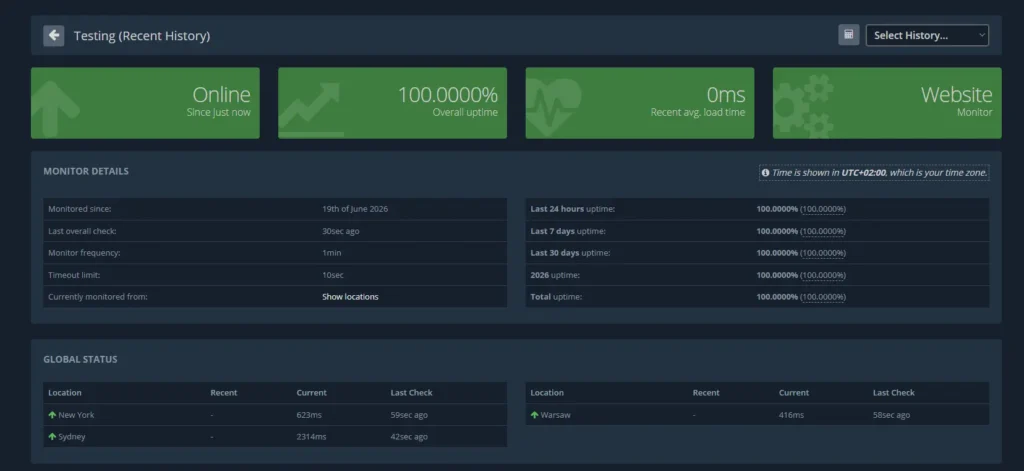
StatusCake dashboard
StatusCake concentrates on uptime checks, performance monitoring, and status pages. It places more emphasis on website availability and performance diagnostics such as page speed testing and global monitoring locations than Better Stack.
Teams that want detailed performance insights alongside uptime monitoring often choose StatusCake.
Key features:
- HTTP(s), TCP, and ping uptime monitoring
- Global monitoring locations
- Page speed monitoring and performance analysis
- Public status pages for incident communication
- SSL certificate monitoring
- Alerting through email, SMS, Slack, PagerDuty, and webhooks
StatusCake offers a limited free monitoring plan with 3 monitors with 15-minute checks and a 7-day free trial for paid plans.
Paid plans start around $20 per month and scale depending on monitoring features, test frequency, and performance tools.
Best fit for:
- Teams monitoring website uptime and performance
- Companies that want global testing locations
- Organizations that want both uptime and page speed monitoring
| Pros | Cons |
| Strong uptime monitoring coverage | Interface can feel dated |
| Includes performance and page speed testing | Advanced features require higher plans |
| Global monitoring locations | Fewer integrations than some competitors |
| Built-in status pages | Pricing increases with monitoring needs |
For dedicated incident management and status pages
Detecting an outage is only the first step. Teams also need a way to communicate incidents, coordinate responders, and keep customers informed while issues are being resolved.
The tools below focus on status pages, incident communication, and on-call management rather than uptime monitoring itself.
Instatus
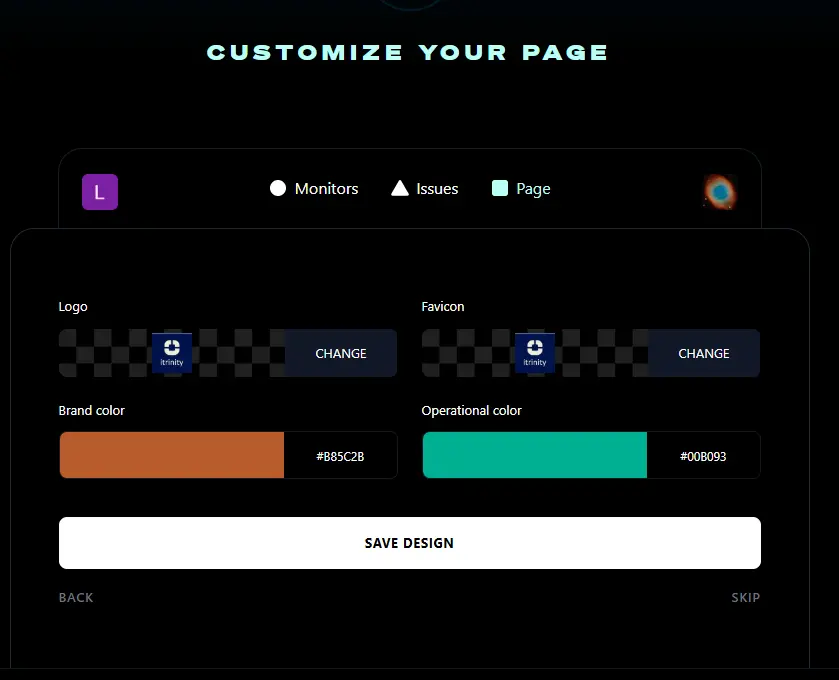
Instatus status page creation dashboard
Instatus is a status page platform built to help companies communicate outages, maintenance events, and service disruptions with customers. Instatus concentrates almost entirely on status pages and incident communication.
This platform is often chosen by startups and SaaS companies that want dedicated status page software without the additional monitoring and observability features.
Key features:
- Public and private status pages
- Incident and maintenance announcements
- Subscriber notifications via email and other channels
- Custom domains and branding
- Multi-language support
- Integrations with monitoring tools
- Team collaboration features
Instatus offers a free plan for smaller projects and has 15 monitors, while paid plans start at around $15 per month and add additional pages, subscribers, customization options, and team features.
Best fit for:
- SaaS companies managing customer communication
- Startups that want professional status pages
- Teams that already have monitoring tools in place
- Organizations looking for a simpler alternative to Better Stack’s status page product
| Pros | Cons |
| Easy to set up and manage | Limited observability features |
| Attractive status page designs | Not a full monitoring platform |
| Affordable pricing | Fewer incident management features |
| Strong customization options | Less suitable for complex enterprise workflows |
Incident.io
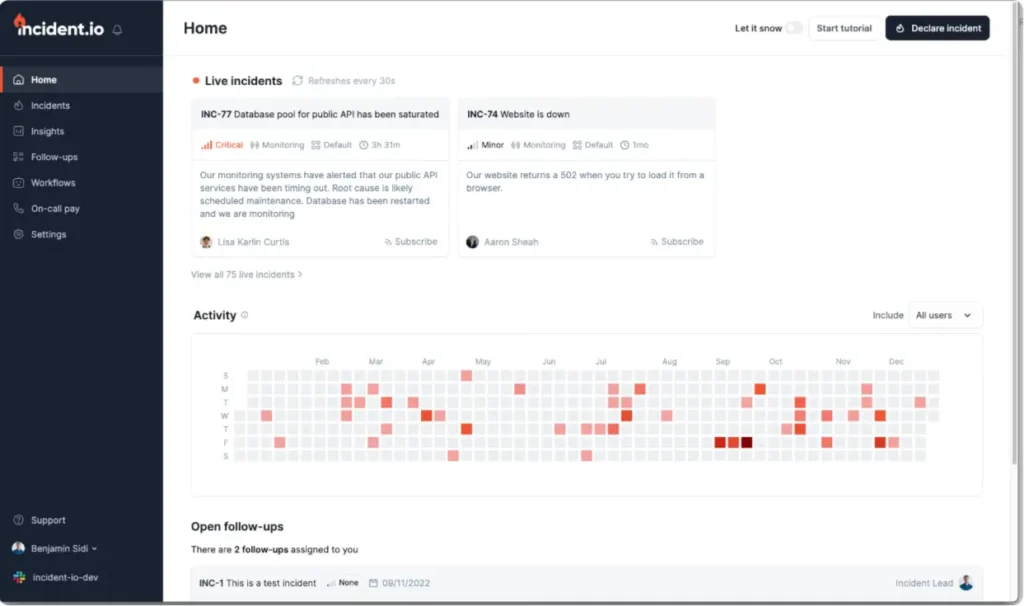
Source: Incident.io dashboard example
Incident.io is an incident management platform designed around Slack and Microsoft Teams workflows. Instead of acting as a monitoring platform, it enables engineering teams to coordinate incidents, manage responders, document events, and communicate updates during outages.
This tool places much more emphasis on collaboration and response processes. Teams that already spend most of their day in Slack often find the workflow more natural than traditional incident management platforms.
Key features:
- Slack-native incident management
- Microsoft Teams support
- On-call scheduling and rotations
- Incident timelines and documentation
- AI-assisted incident workflows
- Built-in status pages
- Postmortem generation
- Integrations with monitoring and ticketing platforms
Incident.io offers a free plan for smaller teams, while paid plans start at $19 per user per month. Additional on-call management features are available on higher tiers.
Best fit for:
- Engineering teams that work primarily in Slack
- SaaS companies with growing operational requirements
- DevOps and SRE teams managing frequent incidents
- Organizations looking for a modern alternative to traditional incident response tools
| Pros | Cons |
| Excellent Slack integration | Per-user pricing can become expensive |
| Modern user experience | Not a monitoring platform |
| Built-in status pages and postmortems | Best suited to Slack-centric teams |
| Strong automation capabilities | Smaller ecosystem than PagerDuty |
PagerDuty
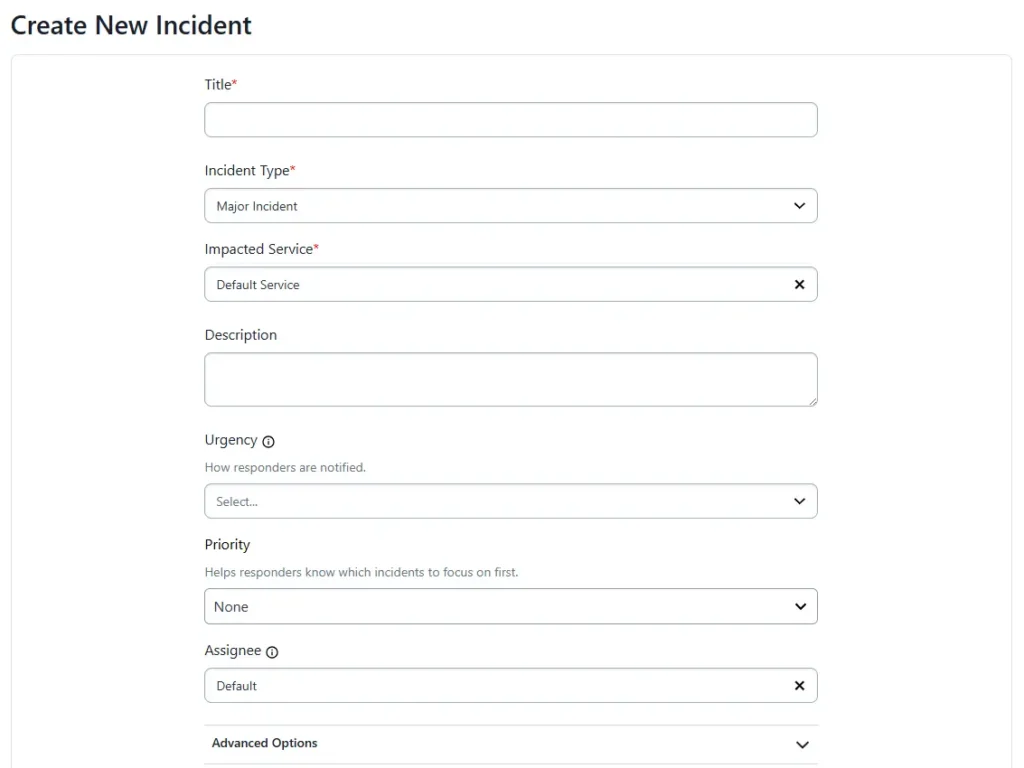
PagerDuty Create New Incident form
PagerDuty is one of the most established incident management platforms on the market. Its strength lies in advanced on-call management.
Large engineering organizations often use PagerDuty alongside monitoring platforms such as Datadog, UptimeRobot, New Relic, or Better Stack to route alerts, manage responder schedules, and automate escalation workflows.
Key features:
- On-call scheduling and rotations
- Multi-level escalation policies
- Incident response automation
- Event orchestration and alert routing
- Voice calls, SMS, email, and push notifications
- Extensive integration ecosystem
- Incident workflows and responder coordination
PagerDuty offers a free plan for small teams. Paid plans start around $24 per user per month and increase based on feature requirements and team size.
Best fit for:
- Large engineering organizations
- DevOps and SRE teams
- Businesses running mission-critical services
- Teams with complex on-call requirements
| Pros | Cons |
| Industry-leading on-call management | Pricing scales with team size |
| Advanced escalation workflows | More complex than many teams need |
| Large integration ecosystem | Not an uptime monitoring platform |
| Mature incident response capabilities | Advanced features require higher-tier plans |
For full-stack observability and enterprise
While Better Stack includes observability features, the platforms below provide deeper visibility into applications and infrastructure, often at the cost of greater complexity and higher pricing.
Datadog
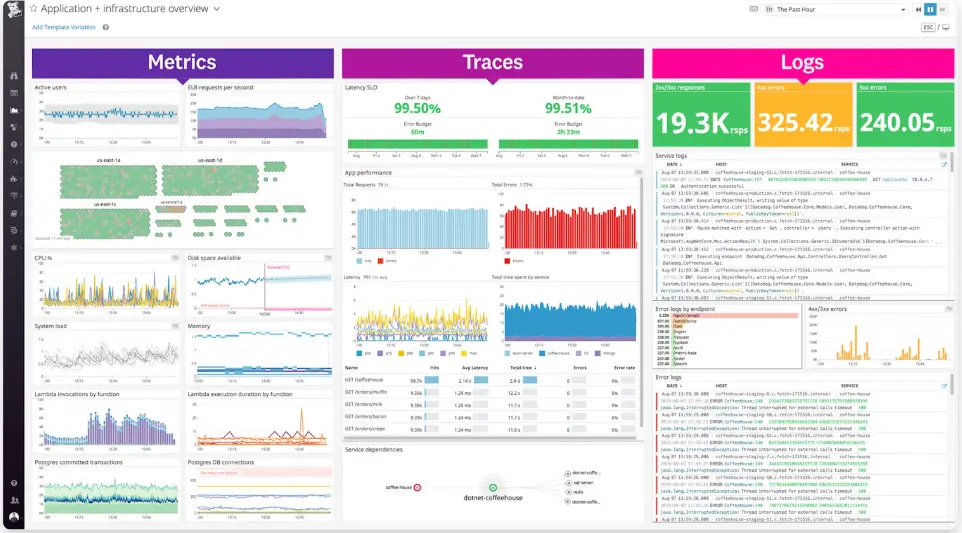
Source: Datadog dashboard example
Datadog is a cloud observability platform made for monitoring infrastructure, applications, logs, and metrics across complex environments.
The platform is more suited for deep observability, with features like distributed tracing, infrastructure monitoring, and advanced analytics.
Organizations running microservices, containers, or large cloud deployments often choose Datadog because it provides broader system visibility and detailed performance insights.
Key features:
- Infrastructure and application performance monitoring
- Log management and distributed tracing
- Real-time dashboards and analytics
- Advanced alerting and anomaly detection
- Large ecosystem of integrations with cloud providers and DevOps tools
Datadog uses a usage-based pricing model that varies depending on monitoring type, data volume, and infrastructure scale. There is also a free plan for up to 5 hosts.
Infrastructure monitoring typically starts around $15 per host per month, with additional costs for logs, traces, and other services.
Best fit for:
- Large engineering teams
- DevOps and SRE organizations
- Companies running complex cloud infrastructure or microservices
| Pros | Cons |
| Full observability platform with logs, metrics, and traces | Can become expensive at scale |
| Large integration ecosystem | Steeper learning curve |
| Powerful dashboards and analytics | Complex pricing model |
| Scales well for large infrastructure environments | Setup requires more configuration |
OneUptime
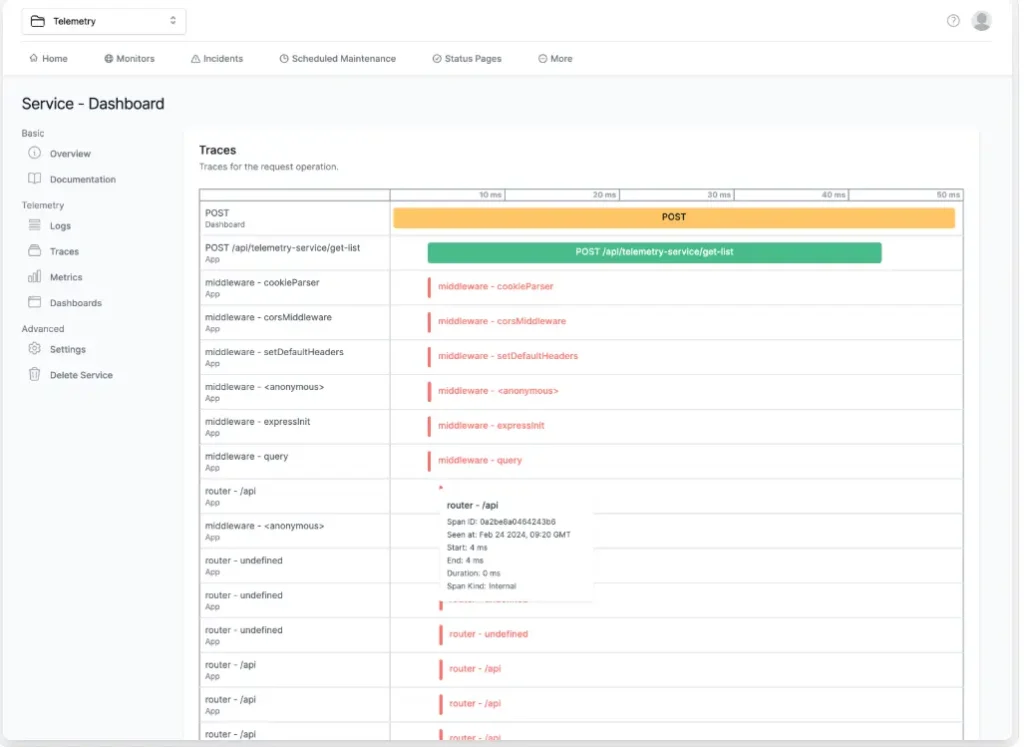
Source: OneUptime dashboard example
OneUptime covers a lot of the same ground as Better Stack. Alongside uptime monitoring, it includes status pages, incident management, on-call scheduling, logs, and traces.
The biggest difference is deployment. Better Stack is only available as a hosted service, while OneUptime can run in your own infrastructure. That makes it worth considering if data ownership, compliance requirements, or internal hosting policies are important to your team.
Key features:
- Uptime monitoring
- Incident management
- On-call scheduling
- Alert escalation workflows
- Public status pages
- Log management
- Distributed tracing
- Self-hosted deployment options
OneUptime offers a free self-hosted edition, while its cloud-hosted plans start at approximately $20 per month and scale based on usage and features.
Best fit for:
- Organizations looking for an open-source Better Stack alternative
- Teams that require self-hosting capabilities
- DevOps and SRE teams managing their own infrastructure
- Companies that want monitoring, incident management, and observability in one platform
| Pros | Cons |
| Open-source and self-hosted | Smaller ecosystem than larger vendors |
| Combines monitoring and incident management | Less mature than Datadog or Splunk |
| Includes logs, tracing, and status pages | Setup can be more involved for self-hosted deployments |
| Greater control over data and infrastructure | Smaller integration library |
Splunk
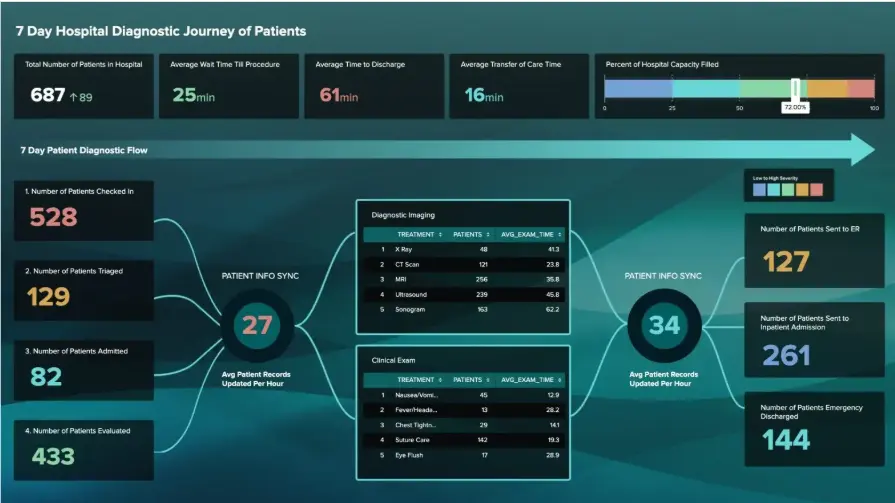
Source: Splunk Dashboard Studio example
Splunk is one of the most established observability and log analytics platforms on the market, and is built for managing large volumes of operational and security data across complex environments.
The platform provides visibility into infrastructure, applications, logs, traces, and user experiences. Its strength lies in helping teams collect, search, analyze, and correlate large amounts of machine-generated data to troubleshoot issues and investigate incidents.
Key features:
- Infrastructure monitoring
- Application performance monitoring (APM)
- Log analytics and investigation
- Distributed tracing
- Real user monitoring (RUM)
- Incident detection and response
- Security and compliance monitoring
- OpenTelemetry-native observability
Splunk Observability Cloud pricing starts at approximately $15 per host per month for infrastructure monitoring, with higher tiers available for application performance monitoring and end-to-end observability. Pricing can increase significantly as deployments grow.
Best fit for:
- Large enterprises
- Security-conscious organizations
- DevOps and SRE teams managing complex environments
- Businesses requiring advanced log analytics and observability
| Pros | Cons |
| Powerful log analytics and search capabilities | More expensive than many alternatives |
| Broad observability coverage | Can be complex to implement and manage |
| Strong security and compliance features | Often more platform than smaller teams need |
| Built for large-scale environments | Pricing can become difficult to predict at scale |
For DIY and DevOps
Open-source monitoring tools offer greater flexibility, complete control over infrastructure, and the ability to avoid per-user or per-monitor pricing. The down side is that setup, maintenance, upgrades, and troubleshooting become your responsibility.
If self-hosting, customization, and infrastructure ownership are priorities, the tools below are worth considering.
Grafana Cloud
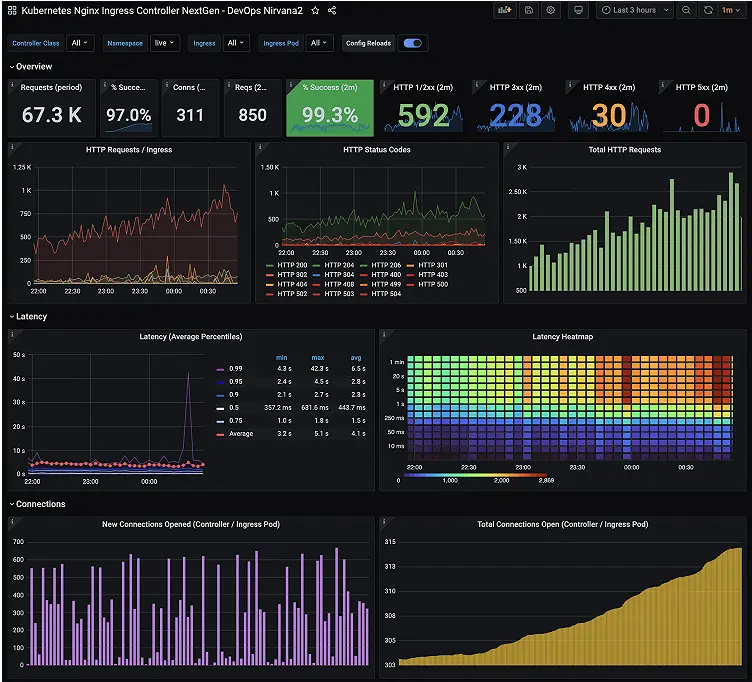
Source: Grafana dashboard example
Grafana Cloud is a hosted observability platform built around the Grafana ecosystem that combines metrics, logs, and traces with customizable dashboards and monitoring tools.
While Better Stack provides a simpler monitoring platform, Grafana Cloud offers a deeper infrastructure observability stack built on tools like Prometheus, Loki, and Tempo.
Teams already using Grafana or running large infrastructure environments often adopt Grafana Cloud for its flexibility and powerful visualization capabilities.
Key features:
- Metrics monitoring with Prometheus
- Log monitoring with Loki
- Distributed tracing with Tempo
- Custom dashboards and visualizations
- Alerting and integrations with DevOps tools
Grafana Cloud offers a free tier with limited usage.
Paid plans scale (starting at $19 per month) based on data ingestion, metrics storage, and additional observability services.
Best fit for:
- DevOps teams already using Grafana
- Infrastructure monitoring and metrics analysis
- Organizations running Kubernetes or complex cloud environments
| Pros | Cons |
| Powerful dashboards and visualization tools | Requires setup and configuration |
| Full observability stack for metrics, logs, and traces | Steeper learning curve |
| Flexible integrations with infrastructure tools | Can become complex for small teams |
| Strong open-source ecosystem | Not focused on simple uptime monitoring |
Uptime Kuma
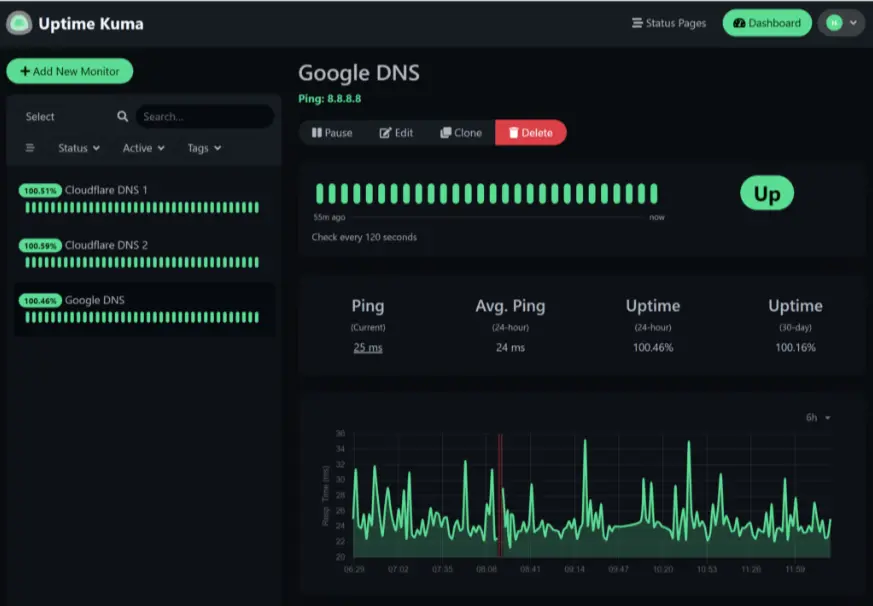
Source: Uptime Kuma dashboard example
Uptime Kuma is a self-hosted uptime monitoring tool designed to track website and service availability with a modern interface and flexible deployment options.
As opposed to managed platforms like Better Stack, Uptime Kuma requires teams to run and maintain their own monitoring environment. This makes it appealing for organizations that want full control over their monitoring infrastructure and data.
Key features:
- HTTP(s), ping, TCP, DNS, and keyword monitoring
- Built-in status pages
- Notifications through email, Slack, Discord, and webhooks
- Docker-based deployment
- Self-hosted monitoring and data control
Uptime Kuma is completely free to use. The only costs come from the infrastructure required to host and maintain it.
Best fit for:
- Developers who prefer self-hosted tools
- Teams wanting full control over monitoring infrastructure
- Organizations avoiding SaaS monitoring platforms
| Pros | Cons |
| Free and open-source | Requires self-hosted infrastructure |
| Clean and modern interface | No managed hosting |
| Flexible monitoring options | Limited enterprise features |
| Built-in status pages | Requires manual maintenance |
Prometheus
Source: Prometheus + Grafana dashboard example
Prometheus is one of the most widely adopted open-source monitoring systems in modern infrastructure and is used mainly for collecting and analyzing metrics.
The platform has become a standard component of many cloud-native and Kubernetes environments. It’s often paired with Grafana, which provides dashboards and visualization for the metrics Prometheus collects.
Because Prometheus is completely open source and self-hosted, organizations have full control over their monitoring infrastructure. That flexibility comes with additional operational overhead, but it also eliminates vendor lock-in and recurring subscription costs.
Prometheus is not a direct replacement for Better Stack’s all-in-one approach. Instead, it serves as a powerful foundation for teams building their own observability stack.
Key features:
- Open-source metrics collection
- Time-series database
- Built-in alerting
- Large ecosystem of exporters and integrations
- Kubernetes and cloud-native support
- PromQL query language
- Self-hosted deployment
Prometheus is free to use under the Apache 2.0 license. The primary costs come from the infrastructure and engineering resources required to deploy, maintain, and scale the platform.
Best fit for:
- DevOps and SRE teams
- Kubernetes environments
- Organizations building a custom observability stack
- Teams that want complete control over monitoring infrastructure
| Pros | Cons |
| Free and open source | Requires technical expertise to deploy and maintain |
| Industry-standard metrics monitoring | No built-in status pages or incident management |
| Large ecosystem and community support | Less beginner-friendly than managed SaaS platforms |
| Highly flexible and customizable | Infrastructure and maintenance costs still apply |
Making the choice: Which tool is right for you?
I’d expand the brief a bit because these recommendation sections tend to perform well and help readers who skipped straight to the conclusion.
Something like:
If you want affordable uptime monitoring
Choose UptimeRobot, Hetrix Tools, or Hyperping.
- UptimeRobot offers one of the strongest free plans available.
- Hetrix Tools combines low-cost monitoring with blacklist monitoring.
- Hyperping provides a modern interface and built-in status pages.
If status pages are your priority
Choose Instatus.
Its entire platform is built around customer-facing communication and incident updates, making it one of the closest alternatives to Better Stack’s status page functionality.
If incident management comes first
Choose Incident.io or PagerDuty.
- Incident.io is ideal for Slack-centric engineering teams.
- PagerDuty is the better fit for large organizations with complex on-call requirements and escalation workflows.
If you need full observability
Choose Datadog, OneUptime, or Splunk.
- Datadog is the enterprise observability leader.
- OneUptime offers a broader open-source alternative with self-hosting options.
- Splunk excels at log analytics, operational visibility, and security-focused monitoring.
If you want complete control over your monitoring stack
Choose Grafana Cloud, Prometheus, or Uptime Kuma.
- Grafana Cloud provides managed observability with Grafana’s ecosystem.
- Prometheus is a powerful foundation for custom monitoring environments.
- Uptime Kuma offers lightweight self-hosted uptime monitoring with a simple setup process.
Next steps
If uptime monitoring is the main reason you’re evaluating Better Stack alternatives, UptimeRobot offers a simpler way to monitor websites, APIs, servers, SSL certificates, domains, ports, and cron jobs.
You can start with 50 monitors and 5-minute checks on the free plan, then upgrade as your monitoring requirements grow.
Create a free account and set up your first monitor in minutes.
-
If uptime monitoring is your main requirement, UptimeRobot, Hetrix Tools, Hyperping, and StatusCake are among the strongest alternatives. Each platform focuses primarily on availability monitoring, alerts, and status visibility rather than broader observability features.
-
OneUptime is one of the closest open-source alternatives because it includes monitoring, status pages, incident management, logs, traces, and on-call management. Teams building their own monitoring stack often pair Prometheus with Grafana, while Uptime Kuma is a popular option for self-hosted uptime monitoring.
-
PagerDuty and Incident.io are the strongest options for incident management. PagerDuty is widely used by larger engineering organizations that need advanced on-call scheduling and escalation workflows, while Incident.io is designed around Slack-based collaboration and incident response.
-
Datadog, Splunk, Grafana Cloud, and OneUptime provide broader observability capabilities than traditional uptime monitoring tools. These platforms support logs, metrics, traces, and infrastructure monitoring, making them a better fit for complex environments.
-
Yes. UptimeRobot, StatusCake, Instatus, Grafana Cloud, and OneUptime all offer free plans or free tiers. Teams that prefer self-hosted software can also use Uptime Kuma and Prometheus at no licensing cost, with infrastructure expenses being the primary consideration.