TL;DR (QUICK ANSWER)
A monitor’s response time measures how quickly your server responds to a request, while users experience the entire page load, including asset downloads, JavaScript execution, rendering, and third-party resources. Both measurements are accurate because they capture different stages of the same request.
Your monitor reports a healthy 200 millisecond response time. Then a user emails to say the site felt sluggish this morning. Both are correct, and the gap between them is one of the most useful things to understand about web performance.
A monitor and a browser measure two different things. Once you understand what each one measures, the difference makes sense. Used together, they give you a much clearer picture of your site’s performance.
Key takeaways
- Response time reflects your server’s performance, not everything the browser does after receiving the response.
- Browser rendering, JavaScript, third-party resources, and network conditions often account for most of the time users perceive.
- Checks from multiple monitoring locations help distinguish regional latency from infrastructure problems.
- Response time alerts notify you as performance degrades, often before users report an issue.
The same answer in five minutes, including how to tell which of the two numbers is telling you something new.
Server response time vs. full page load
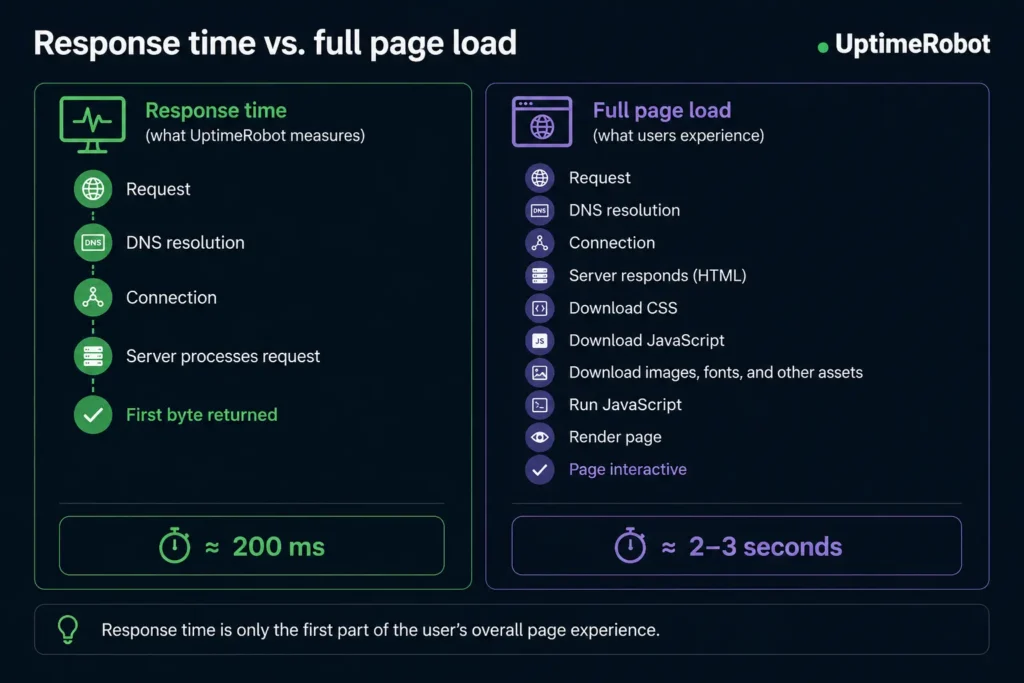
When a monitor makes an HTTP request to your site, it measures the time from sending the request to receiving the server’s response. That covers DNS resolution, the connection, and your server returning its initial response. It is a clean measurement of how quickly your infrastructure answers.
A full page load is a much larger sequence. The browser parses the HTML, discovers it needs dozens more resources (like stylesheets, scripts, fonts, and images), and requests each one. Some of these resources can delay rendering. Stylesheets and certain scripts must be processed before the browser can display meaningful content, while JavaScript often has to be downloaded, parsed, and executed before the page becomes interactive. Even when the server responds quickly, these browser-side tasks can add significant delay.
The initial response is often a small fraction of that total. A page can respond in 200 milliseconds and still take two or three seconds to become interactive. Your monitor is reporting the start of the timeline, but your user is reporting the finish.
This isn’t a shortcoming of either one. A focused response time is exactly what you want from an uptime monitor, because it isolates the component you operate and can act on.
Response time vs. full page load
Third-party scripts and external dependencies
One of the most common reasons a page feels slower than the response suggests is third-party content, such as analytics tags, ads, chat widgets, embedded media, tag managers, and externally hosted fonts.
Each of these is a request to someone else’s infrastructure, and its speed is outside your control. When a third-party provider is slow, distant, or heavy, that delay lands in the user’s browser while your response time stays untouched. A page can wait on a slow analytics endpoint or a distant font server long after your server delivered its part flawlessly.
Geography and network distance
Physical distance adds latency, and where a measurement is taken from changes the number.
If your monitor checks from a location near your servers or a CDN edge, the response time will be low. A user on another continent will see additional latency simply because data takes time to travel. Both experiences are real; they’re just measured from different places.
Checking response times from multiple locations distinguishes regional latency from infrastructure problems. If one region suddenly becomes slower while others are stable, you immediately have a much clearer starting point for troubleshooting.
Device and network conditions
The user’s own device and connection shape their experience in ways no server-side measurement can capture.
A monitor runs on capable infrastructure with a fast, stable connection. A real user might be on an older phone, congested public WiFi, or a mobile connection with variable signal. Each slows the browser’s work of downloading and rendering, independent of your response time.
Processing-heavy pages feel this most. A JavaScript-heavy page renders quickly on a powerful machine and slowly on an older phone. The server sent the same response to both, but the experience diverged entirely on the user’s side.
Synthetic monitoring vs. real user monitoring
These two approaches measure performance differently, and the distinction resolves most of the confusion.
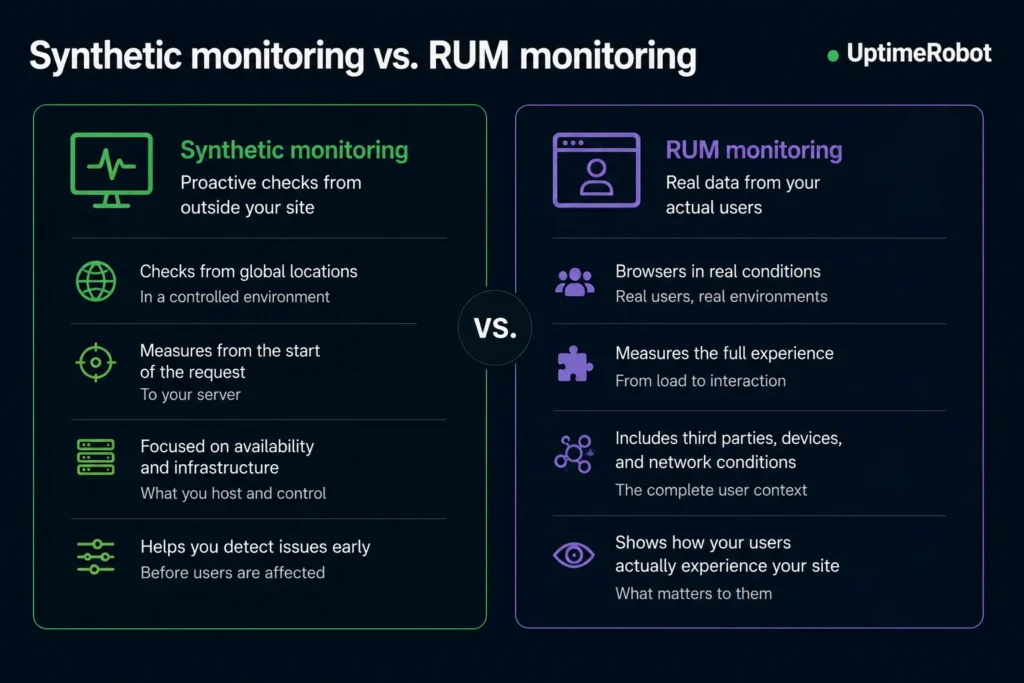
Synthetic monitoring performs consistent checks from known locations and is ideal for tracking uptime and response times over time.
Real user monitoring (RUM) measures how actual visitors experience your site on different devices, browsers, and networks.
While RUM can provide additional context, response time monitoring is the quickest way to figure out whether a slowdown originates with your infrastructure or somewhere else in the delivery path.
Synthetic monitoring vs. real user monitoring
How to use both readings together
Treat the gap between monitor response time and user experience as a diagnostic, not a contradiction.
Start with synthetic monitoring as your baseline for infrastructure health. A consistently fast response time tells you your server is doing its job, and any change is worth investigating.
Then compare that with real user experience. If your response time remains stable but users report slow pages, the cause is likely elsewhere. Browser rendering, JavaScript execution, third-party resources, network conditions, or the user’s device are all common contributors.
Looking at both measurements together lets you narrow down where the problem originates. Instead of guessing whether a slowdown is caused by your infrastructure or the browser, you can rule out one side quickly and focus your investigation where it matters.
Configure response time alerts
Don’t wait until users report a slowdown.
Response time alerts notify you when performance exceeds the thresholds you define, so you can address performance degradation before it develops into an outage. Combined with uptime monitoring and checks from multiple locations, they provide an early warning system for infrastructure issues.
Start monitoring response time with UptimeRobot
Keep an eye on response times from multiple locations and receive alerts when performance crosses your thresholds. The sooner you spot a slowdown, the sooner you can start investigating.
-
Because they measure different things. A monitor measures how long your server takes to respond, which is usually fast. A user experiences the full page load: asset downloads, script execution, rendering, and third-party content. Both readings are accurate; they capture different stages of the same request.
-
Response time is how long your server takes to return its initial response. Page load time is how long the whole page takes to become usable, including that response plus asset downloads, script execution, rendering, and third-party content. Response time is one component of page load time, usually a small one.
-
Synthetic monitoring makes controlled checks from known locations at set intervals, ideal for reliably detecting outages and tracking response time. Real user monitoring measures actual visitors on their own devices and networks. Synthetic is the stable signal that catches problems; RUM captures real-world variation. They complement each other.
-
They generally do not affect your server’s response time, since that measures your own infrastructure. But they do affect the user’s page experience, because the browser has to load analytics, ads, widgets, and fonts, each dependent on someone else’s servers. This is a common reason a page feels slower than the monitored response time.
-
Both, for different purposes. Trust your monitor as the reliable measure of infrastructure health and the fastest way to detect an outage. Trust user experience as the measure of the complete, real-world page load. When they differ, the gap shows how much is coming from browser-side and external factors rather than your server.