Monitoring is much easier to configure before launch than during your first production incident. Before real users arrive, you have time to decide what needs monitoring, where alerts should go, and how you’ll tell the difference between a brief interruption and a real outage.
Pre-launch testing also gives you a chance to trigger failures deliberately and confirm that your monitors, notifications, and escalation paths work as expected.
This checklist covers what to configure before a SaaS product, API, infrastructure service, or AI/cloud endpoint starts taking real traffic.
Start from the SLA, not the tool
A service level agreement (SLA) defines the level of service you commit to providing customers and how that performance will be measured. For a SaaS product or API, that commonly includes targets for uptime, response time, support response times, and what counts as downtime.
Set those expectations before choosing your monitors. If your SLA promises 99.9% monthly uptime, for example, you have roughly 43 minutes of allowable downtime each month.
Your monitoring interval and alert routing will need to detect incidents quickly enough for your team to stay within that commitment.
The SLA should also define how performance is measured. Decide which endpoints represent availability, which regions matter, whether planned maintenance is excluded, and how quickly different types of incidents require a response.
Those decisions give you something concrete to monitor instead of adding checks simply because they’re available.
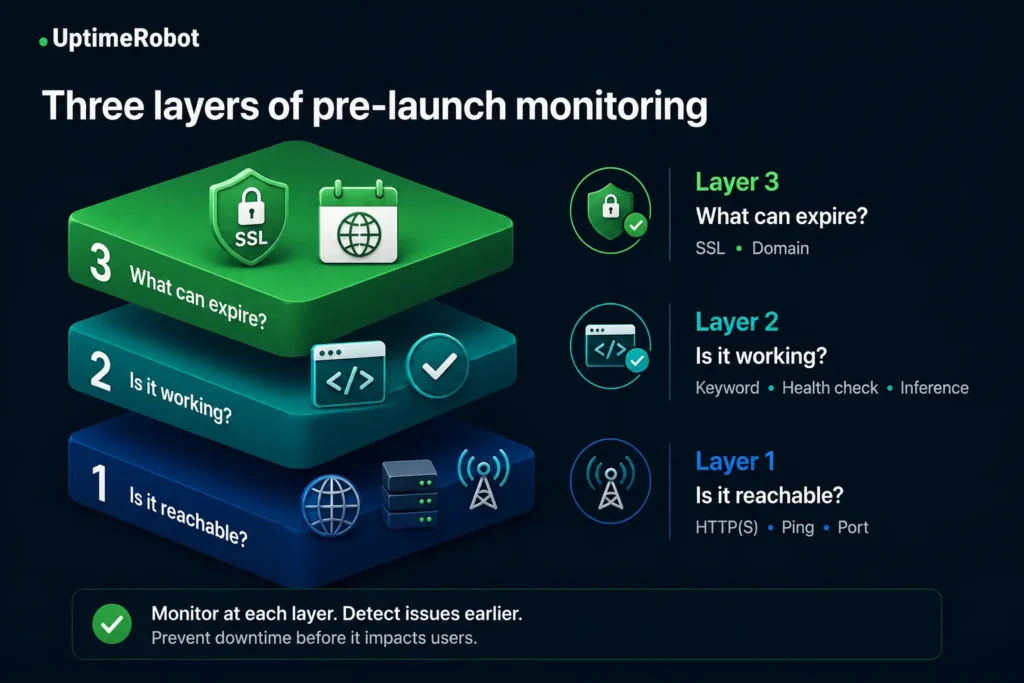
When those targets are defined, you can build your monitoring setup around them. We’ve put together a three layer approach.
Layer 1: is it reachable?
Start with the outside-in view a customer gets.
Website / HTTP(S) monitoring on every public URL: marketing site, app domain, login page, docs.
Ping monitoring where you need to know the host itself is alive, separately from whether the web service on it is answering.
Port monitoring for network services with no HTTP layer of their own. The usual pre-launch list is 22 (SSH), 25 (SMTP), 443 (HTTPS), 3306 (MySQL), and 5432 (PostgreSQL).If transactional email is critical to your product, monitor the relevant mail port too. SMTP failures can disrupt signup emails, password resets, and other important messages even while the rest of your service remains available.
These checks confirm that your services are reachable, but not that they’re working correctly.
Layer 2: is it working?
A page can return 200 OK and still be broken. A successful response only confirms that the endpoint responded. It won’t necessarily catch broken content, failed dependencies, authentication errors, or other problems that leave the service reachable but unusable.
Keyword monitoring closes that gap by checking whether specific text appears on the page. Monitor for content that should always be present when the page is working correctly, or for error messages that indicate something has gone wrong.
For APIs, a health check endpoint can verify that the services behind the endpoint are working as expected. Before launch:
- Create a /health endpoint that reports actual service health instead of returning a hardcoded ok.
- Include critical dependencies such as your database, cache, and upstream providers.
- Monitor the response for expected values such as “status”: “ok” or “db_connected”: true, instead of checking only the HTTP status code.
For AI services, monitor a real inference request in addition to endpoint availability. An API can remain reachable even when the model behind it can’t successfully complete a request.
Layer 3: what can expire?
SSL certificates and domain registrations both have expiration dates, which makes these failures possible to catch well in advance.
SSL certificate expiry: On paid plans, an HTTPS website monitor checks the certificate automatically; no separate monitor slot required. The check runs every 24 hours, with default reminders at 30, 14, 7, and 0 days ahead of time, and you can adjust those dates. Auto-renewing certificates from Let’s Encrypt or Cloudflare typically send their first warning around 14 days before expiration. It will also notify you when there’s an SSL error.
Domain expiry: An expired domain can disrupt your website, email, and other services that depend on it. Route expiration alerts to someone with access to the registrar account so they can act before the registration lapses. It’s also part of HTTPS monitoring, so it doesn’t count as an extra monitor.
With these three layers in place, you’re covering reachability, functionality, and expiration risks. The next steps refine how and where you monitor, and what happens when a check fails.
Set the response time threshold before you have traffic
Response time monitoring, another addition to HTTPS monitoring, can alert you when your service is still available but performing slower than expected.
Before launch, use load testing to establish a baseline for normal performance. Set your alert threshold above routine fluctuations so you’re notified when response times indicate a meaningful performance problem.
Your initial threshold doesn’t have to be permanent. Once the service is live and you have enough production data, review it against real-world performance and adjust it as needed.
Make sure your service works where it matters
Monitoring from multiple locations can reveal regional outages and performance problems that a check from a single location may miss. A CDN or routing issue affecting one region may not appear in checks running elsewhere.
With multi-location monitoring, you can check availability from the regions that matter to your service. UptimeRobot’s paid plans include locations across North America, Europe, Asia, and Australia, while the Free plan monitors from North America.
Heartbeats for everything on a schedule
Standard uptime checks can’t detect when a scheduled job fails to run. Heartbeat monitoring covers tasks such as backups, billing runs, and data syncs by checking that they complete on schedule.
Heartbeat monitoring gives each monitor a unique URL that your scheduled job calls when it runs successfully. If UptimeRobot doesn’t receive the expected heartbeat within the configured interval and grace period, you can be alerted that the job may have failed.
Set the expected interval and grace period based on the job’s normal schedule, with enough room for routine variations in completion time.
Decide where each alert should go
Before launch, decide which alerts need an immediate response, who should receive them, and when notifications should repeat.
Tier your monitors: Production-critical checks should reach someone immediately through mobile push notifications, iOS Critical Alerts, SMS, voice, or an on-call tool. Important but less urgent checks can notify a team channel, while lower-priority alerts can go to channels that aren’t monitored continuously.
Attach contacts to roles, not people: A monitor routed to one engineer’s phone stops working when they take vacation or change teams.
Use the delay and recurrence settings: On paid plans you can set how long to wait after a failure before notifying, and how often the alert repeats. A short delay on noisy monitors prevents most false pages; a sensible recurrence stops a two-hour incident from generating a hundred messages.
Build your status page before the first incident
A status page is a central place to share uptime information and incident updates with your customers. You can add as many of your existing monitors as you want, and paid plans give you more options to customize the page to match your brand.
Set it up before launch so it’s ready when you need it. If you want a custom domain, configure the CNAME and certificate in advance rather than trying to do it during an active incident. You can also define maintenance windows so planned work doesn’t trigger unnecessary alerts.
Want to set yours up? Learn how to build a status page for free, or watch the video below.
Test the full alert path
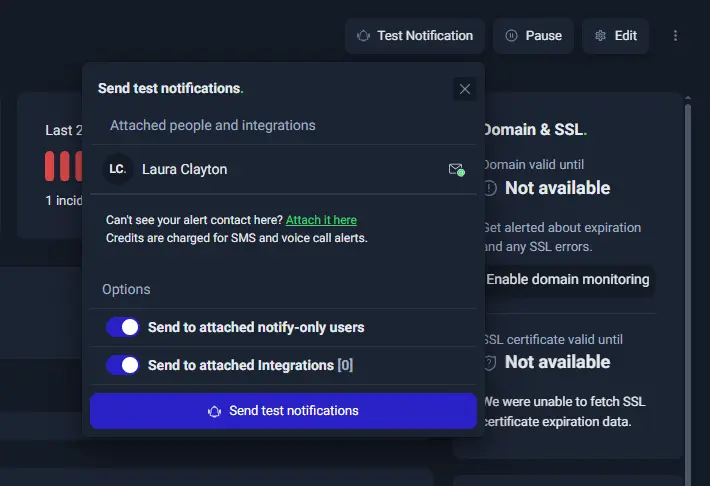
Before launch, test each notification channel and confirm that alerts arrive at the actual destination. A successful test in the dashboard confirms that the notification was sent, but you should also check that it reaches the expected phone, inbox, or integration.
Next, run an end-to-end test using a monitor and endpoint you can safely take offline. Confirm that the monitor detects the failure, the right people receive the alert through the expected channels, and a recovery notification arrives when the service comes back online.
Once you’ve tested the complete monitoring and alerting process, use the checklist below for a final review before launch.
The pre-launch checklist
- Define your SLA, including uptime targets and response commitments.
- Add website / HTTP(S) monitoring to public URLs, plus ping or port monitoring where needed.
- Add keyword monitoring to catch pages that respond but aren’t working correctly.
- Create a health endpoint for APIs and validate the expected response.
- Confirm SSL and domain expiry monitoring is active and alerts reach someone who can act on them.
- Set response time thresholds based on pre-launch performance testing.
- Select monitoring regions based on where your users are located.
- Add heartbeat monitoring for critical scheduled jobs.
- Decide which monitors require an immediate response and where less urgent alerts should go.
- Route alerts to appropriate roles or shared channels and configure notification delays and recurrence.
- Set up your status page and maintenance windows before launch.
- Test every notification channel and run an end-to-end failure and recovery test.
Monitoring requirements will change as your service and user base grow, but this gives you a baseline you can test before launch. Review the setup after you have real production data, and adjust your monitors, thresholds, and alert routing as needed.
-
A typical first launch is a marketing site, an app domain, a health endpoint, a few critical API routes, keyword checks on the pages that matter, and a heartbeat per scheduled job. That usually lands between 20 and 40 monitors, and the free plan covers up to 50 at 5-minute intervals.
-
Match it to your error budget. Five minutes is fine for internal tools and staging, but if you’re promising 99.99%, a 1-minute interval on your customer-facing tier detects problems while most of your monthly budget is still intact.
-
Yes, at lower intensity and routed away from anyone’s phone. A single HTTP check on staging catches broken deployments without adding noise to your on call path.
-
If you have users outside your primary region, yes. Regional CDN and DNS problems are common and completely invisible to a single-region check.
-
Testing the alert path. Teams configure monitors carefully, never verify that notifications actually arrive, and make the first real test of the system also the first real incident.