Your GIS portal is online, but users still can’t access the data they need. What’s gone wrong?
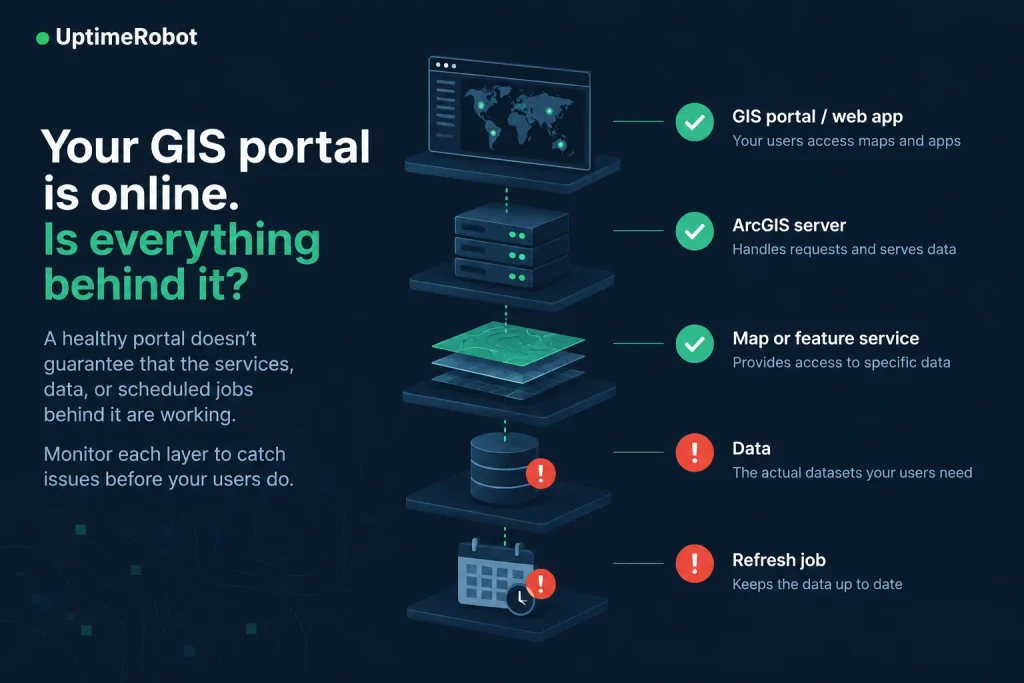
A geographic information system (GIS) has several layers that can fail independently. The web application might be available while an ArcGIS service is down, a dataset is empty, or a scheduled refresh job has failed.
Basic uptime monitoring only covers the first part of that chain. To catch problems before users report them, you need to monitor the services and data behind the application too.
In this article, we’ll use ArcGIS as the main example and look at how to monitor each layer, from server health and API responses to the data itself and the jobs that keep it updated.
We’ll cover:
- Why monitoring the front door isn’t enough
- The 200 OK problem and response-body errors
- How to monitor an ArcGIS health-check endpoint
- How to monitor individual services and actual data
- How to catch failed refresh jobs
- Why monitoring locations matter
- Where to route the alerts
The response body matters too
An HTTP status code only tells you part of what happened. With ArcGIS REST APIs, the response body can contain structured error information that gives you a much clearer picture of why a request failed.
For example, ArcGIS uses error code 498 when a token is invalid or expired and 499 when a required token is missing. A typical error response looks like this:
{

  "error": {

    "code": 499,

    "message": "Token Required",

    "details": []

  }

}
That makes response validation useful alongside basic HTTP monitoring. Instead of checking only whether an endpoint responds, you can verify that the body contains the data or values you expect and alert when it returns an error object instead.
With API monitoring, you can validate specific parts of an API response, while a keyword monitor can provide a simpler check for expected or unexpected content.
Start with the health check, but don’t stop there
ArcGIS Server provides a built-in health check endpoint:
https://<host>/<instance>/rest/info/healthcheckA healthy site returns HTTP 200 with {“success”: true}, while an unavailable site returns a status other than 200. Esri recommends requesting the HTML response if you’re using the endpoint specifically to monitor HTTP status.
This is a useful baseline check, but it only tells you whether the ArcGIS Server site can receive and process requests. It doesn’t tell you whether an individual service is working or returning the data you expect.
Use the health check as your first monitor, then add checks for the services your users and applications actually depend on.
Monitor the service, not just the server
Once the server itself is covered, monitor the individual services your applications and users rely on.
For example, an ArcGIS map service can be checked through its REST endpoint:
https://<host>/arcgis/rest/services/<folder>/<service>/MapServer?f=jsonThe response includes information about the service and its layers, giving you something more specific to validate than server availability alone.
With API monitoring, you can check for an expected property or layer in the response and alert when it disappears or changes unexpectedly.
You don’t need to monitor every service. Start with the ones used by public applications, partner integrations, dashboards, or other important workflows.
Query the data, not just the metadata
service can be online and responding normally even when the data itself has a problem. A failed refresh, database issue, or upstream error could leave a layer empty or out of date without taking the service offline.
For important datasets, query the data directly. For example, this ArcGIS Feature Service query returns the number of records in a layer:
https://<host>/arcgis/rest/services/<service>/FeatureServer/0/query

?where=1%3D1

&returnCountOnly=true

&f=json

With returnCountOnly=true, the response contains the number of matching records:

{

  "count": 2847

}
You can then alert if the count falls below a reasonable threshold for that dataset. This gives you a simple check that the service isn’t just available, but actually contains the data you expect.
The parts that aren’t HTTP at all
A healthy API doesn’t necessarily mean everything behind it is working. Database connections, scheduled imports, ETL jobs, and other dependencies can fail without taking the endpoint offline.
For network-level dependencies, a port monitor can check whether a specific TCP service is reachable. Keep in mind that an open port only confirms that the service is accepting connections. It doesn’t tell you whether the data itself is correct.
Scheduled refresh jobs are a better fit for heartbeat monitoring. Each time the job completes, it sends a request to a unique UptimeRobot URL. If the expected request doesn’t arrive, you get an alert.
Check from where your consumers actually are
Partners, contractors, mobile apps, and third-party systems may access your GIS services from different parts of the world. A service that works from your office may not be reachable everywhere your users are.
With multi-location monitoring, you can check services from the regions that matter to your users and identify outages or connectivity problems that only affect certain locations.
Choose regions based on where your services are actually used instead of monitoring from everywhere by default.
Watch for slower response times
A GIS service doesn’t have to be offline to cause problems. Slow spatial queries can lead to timeouts in dashboards, mobile apps, and other systems that rely on the data.
Response time monitoring can alert you when a service exceeds a set threshold, so you can catch sustained performance problems before they become outages.
Set thresholds based on the service’s normal performance. A complex spatial query may naturally take longer than a simple metadata request, so the same limit won’t make sense for every endpoint.
Send alerts to the right team
The team responsible for your GIS services may not be the same team monitoring your website. Route alerts from these monitors to the people who can actually investigate them.
UptimeRobot supports multiple notification channels, including email, SMS, Slack, Microsoft Teams, PagerDuty, and webhooks. Assign the appropriate channels to each monitor so an API or data issue reaches the right team.
For public-facing GIS services, you can also add relevant monitors to a status page to keep users informed during an incident.
GIS monitoring checklist
GIS monitoring works best when you check each part of the path between your users and the data they need. Use this checklist to make sure you’re covering more than basic availability:
- Server: Monitor the ArcGIS health check endpoint.
- Services: Check the individual map and feature services your users rely on.
- Responses: Validate API responses for expected values and errors.
- Data: Query important datasets to catch missing or unexpected data.
- Refresh jobs: Use heartbeat monitoring to catch failed scheduled jobs.
- Performance: Set response-time thresholds based on normal performance.
- Locations: Monitor from regions where your services are actually used.
- Alerts: Route notifications to the team responsible for the service.
- Communication: Add public-facing services to a status page when appropriate.
You don’t need to monitor every endpoint or dataset from day one. Begin with the services that matter most to your users, then add more checks where a failure would have a real impact.
Ready to go beyond basic uptime? Start monitoring your APIs, services, and scheduled jobs with UptimeRobot and get alerted when something goes wrong.
-
An HTTP status only tells you part of what happened. ArcGIS responses can also contain structured errors, such as 498 for an invalid or expired token and 499 when a token is required. API or keyword monitoring lets you validate the response itself.
-
The ArcGIS Server health check tells you whether the server can receive and process requests. Monitoring an individual service tells you whether the specific map or feature service your users rely on is available and responding as expected. For important services, you need both.
-
Use your monitor’s authentication options instead of putting a long-lived credential directly in the URL. UptimeRobot supports authentication and custom request headers for monitors.
-
There’s no universal number. Start with the ArcGIS health check, your most important services, critical data queries, and scheduled refresh jobs. Add more monitors based on the failures that would have the biggest impact on users.
-
Start with an important consumer-facing data endpoint and validate its actual response. This checks more than whether the server is online and can catch problems with the service or response itself.